
October 30, 2025
|
3
minute read
Tell your growth story with Track Dashboards


See what’s driving growth, retention, and loyalty — all in one view.
You told us reporting shouldn’t be a chore.
You asked for faster, simpler ways to turn your data into reports you'd actually use, fewer clicks, more visualization, and less reliance on external tools.
So we revamped Lexer Track around retail-ready tables and charts that plug straight into your segments, events, and metrics. Track is now more intuitive, faster to build, nicer to look at, and easier to get value from your data.
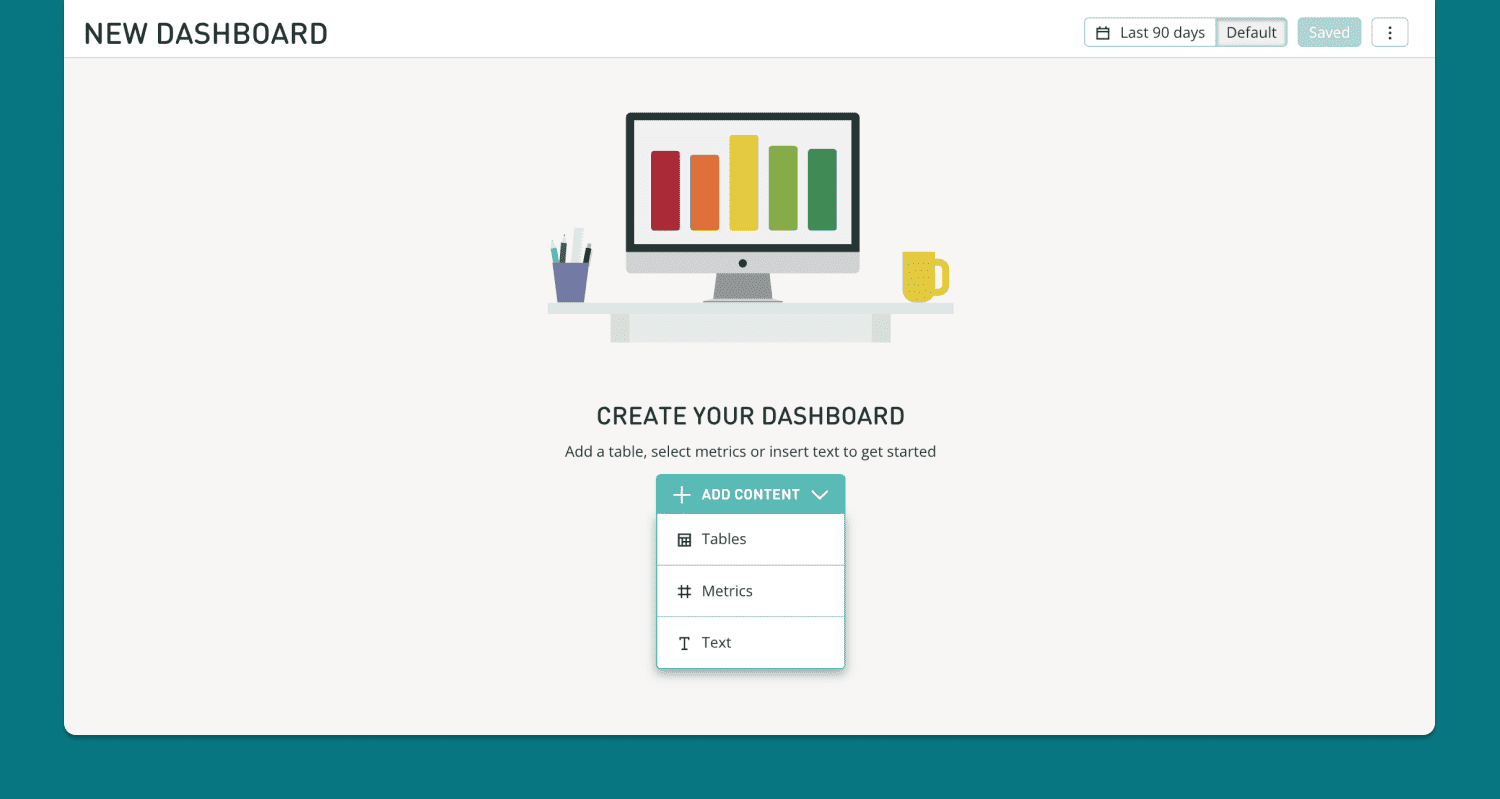
The new Track Dashboards
With the new and improved Lexer Track Dashboards, retailers can tell the full story of their customer growth.
Ecommerce sales, in-store POS data, product performance, and customer engagement all come together in a single, connected view.
Track Dashboards unite every data type - attributes, events, segments, and KPIs - giving teams a clear, real-time understanding of how customers shop, interact, and grow.
Retailers rely on Lexer
Track Dashboards make customer-centric reporting simple. Instead of exporting data into external tools, you get instant, reliable reports powered by the Lexer CDXP.
Now faster to build, easier to use, and designed for every team.
- Clarity without complexity: Get the metrics you need instantly
- From data to decision: Spend less time building reports and more time acting on insights
- Retail-tuned reporting: Metrics for AOV, LTV, retention, and segment performance
- One platform, fewer tools: Eliminate the need for external add-ons
- Immediate ROI: Track users see instant value with best practice dashboards
Track the metrics that matter
Tuned for retail growth. Every report is powered by Lexer’s Customer Data Platform - connecting segments, transactions, and behavior into one reliable view.
Start tracking:
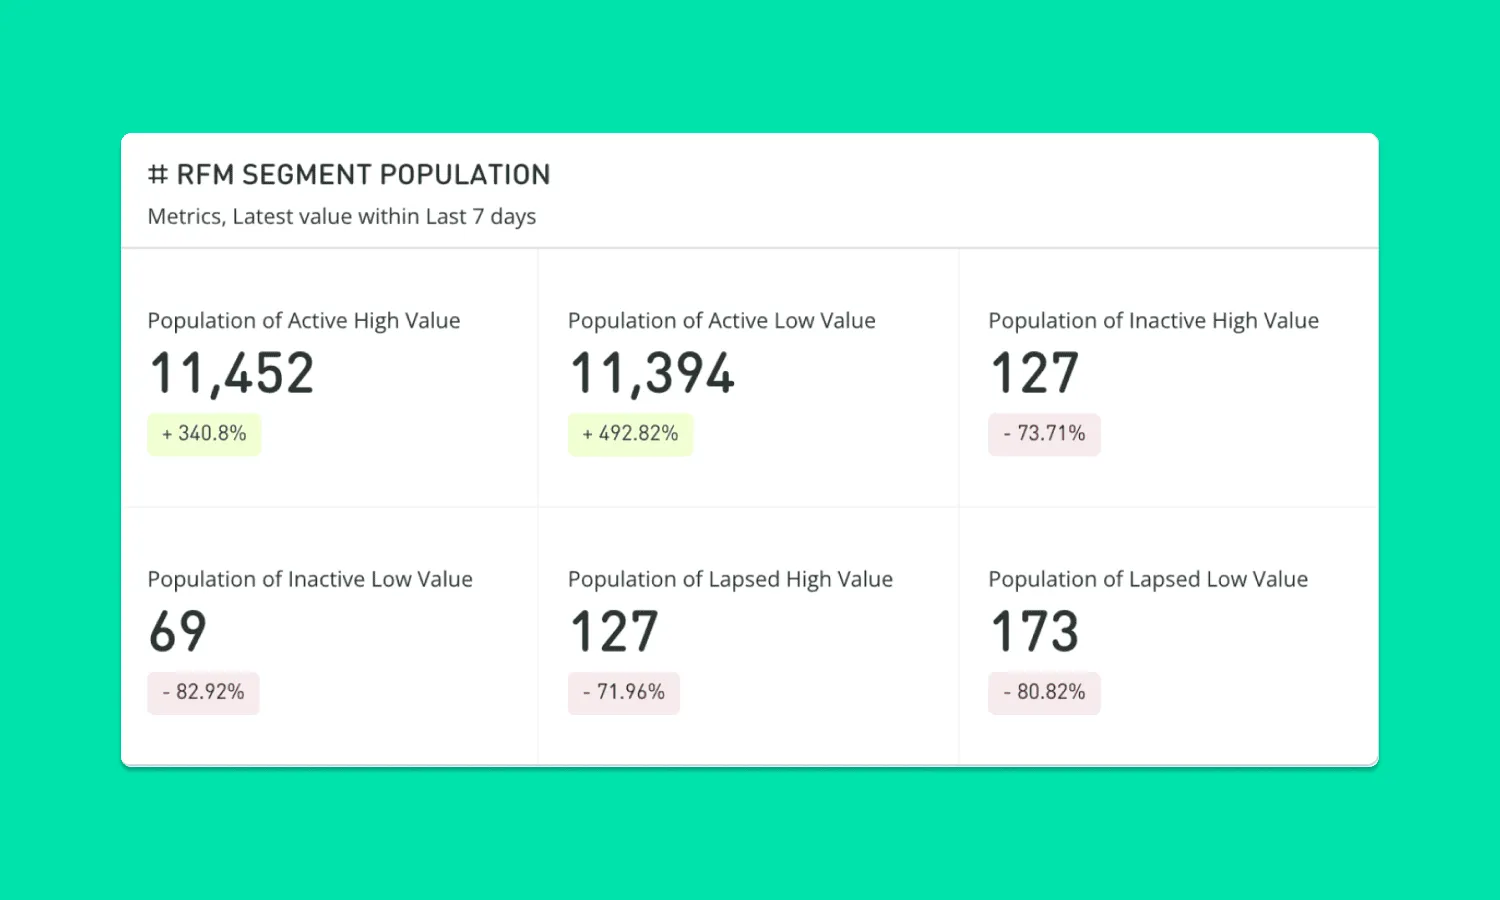
- Loyalty and retention: Track VIPs, churn risk, and RFM lifecycle metrics
- Omnichannel performance: Compare store, e-commerce, and marketplace performance in one view
- Campaign ROI: See which channels and promotions create repeat buyers
- Executive reporting: Deliver a single source of truth to your leadership team
- Team dashboards: Ready-to-use views for marketing, e-commerce, retail, and customer teams
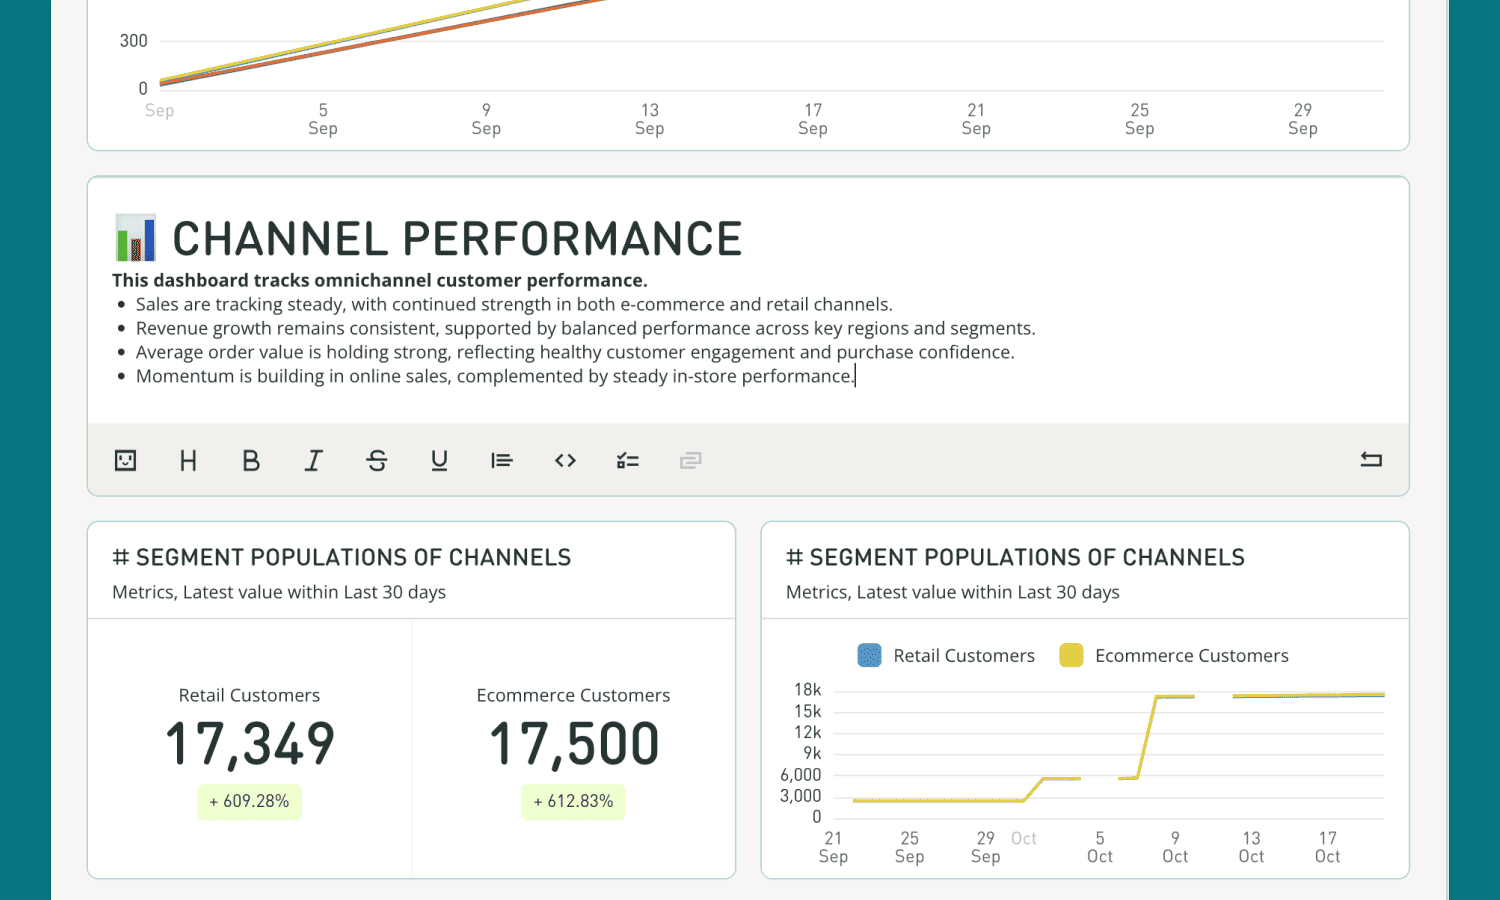
Tell the full customer story
Combine tables, metrics, time series, and bar charts to create a complete view of performance.
Measure what matters
Choose from customer-level attributes or event data for a complete view of business and campaign impact.
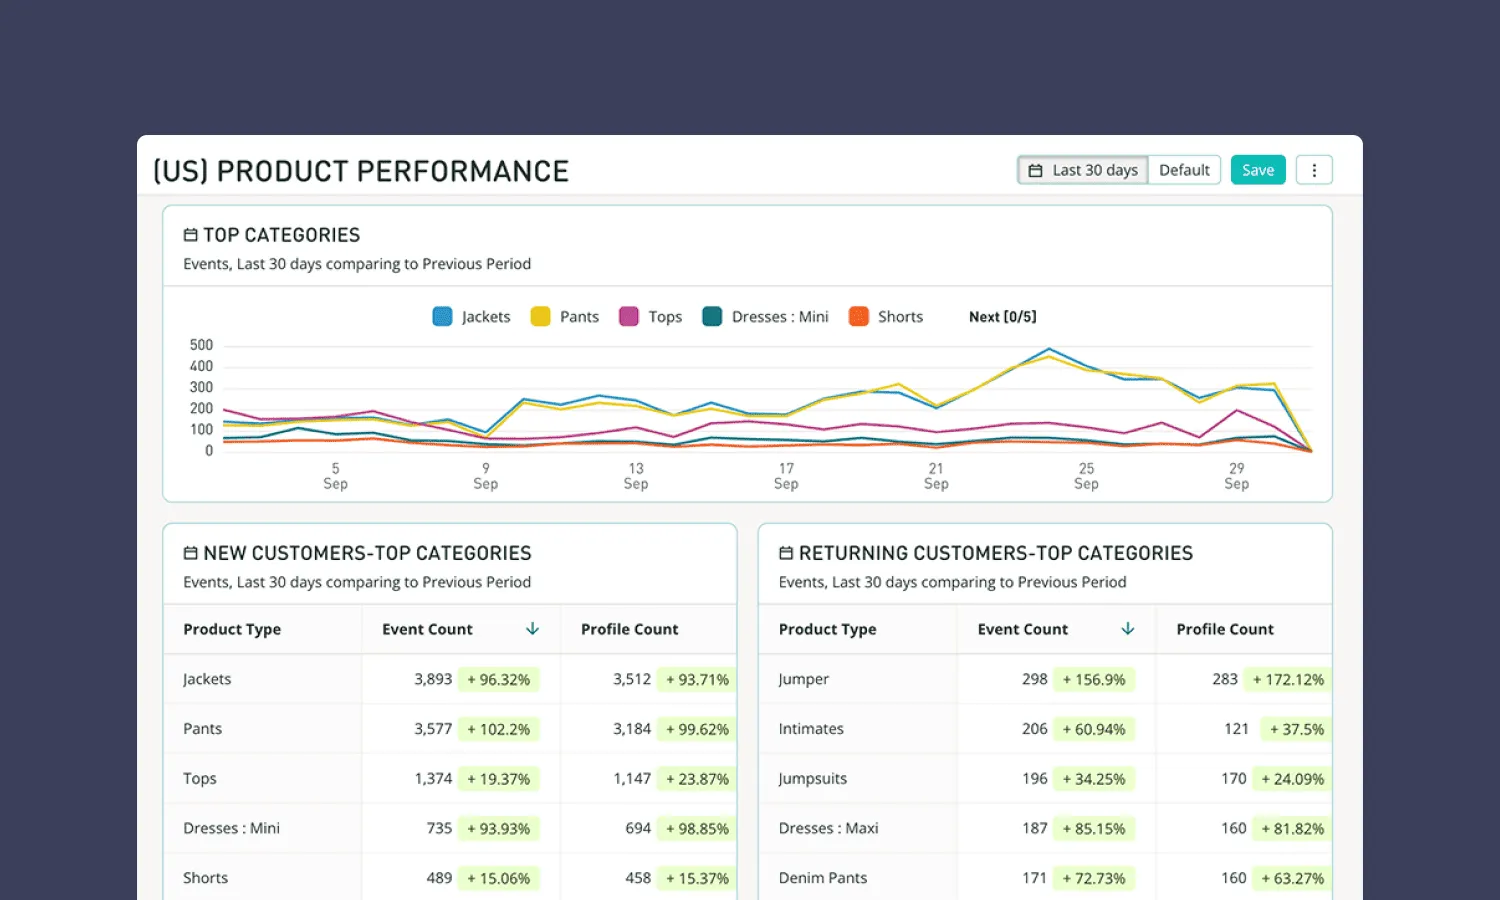
Compare performance
Use period comparisons to track progress with clear deltas that highlight growth or areas for improvement. Compare week-on-week, quarters, and even year-on-year performance.
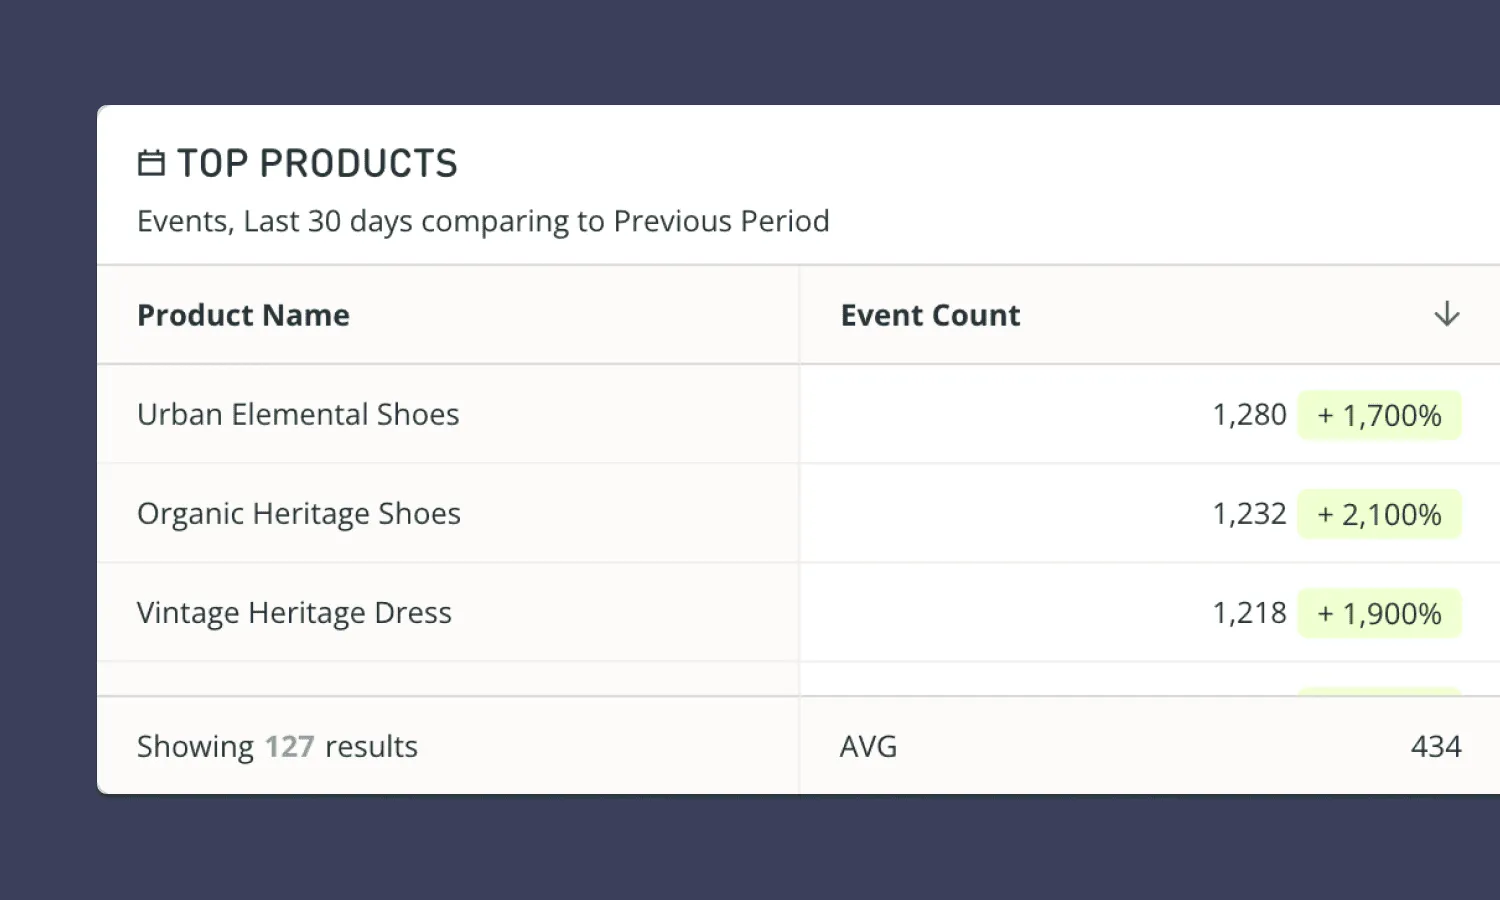
Add event insight
Embed Event Explorer Tables to track customer behavior, sales patterns, and product performance in one connected view.
Set campaign dates
Lock cards to fixed periods like BFCM, holiday sales, or quarterly campaigns so reporting stays accurate and consistent.
Flexible layouts
Drag, drop, resize, and duplicate cards to design dashboards that reflect your team's needs.
Add labels and callouts
Annotate your charts with insight callouts to point out growth trends, milestone moments, or campaign results in context.
All of your customer metrics, together
With the new Lexer Track Dashboards, every retailer can now see the full picture of their customers in one connected view.
From customer behavior to campaign performance and sales trends, everything comes together to tell a story of growth. Simple to build, easy to use, and powered by connected customer data, Track Dashboards help turn insight into action for every team, every day. Available now.
FAQs
What's new in the revamped Lexer Track Dashboards?
Track now features retail-ready tables and charts with faster build times, intuitive visualization, flexible drag-and-drop layouts, period comparisons, event tracking, campaign date locking, annotation callouts, and unified views combining ecommerce, POS, product performance, and customer engagement.
What metrics can I track with the new Track Dashboards?
Track VIP loyalty, churn risk, RFM lifecycle, omnichannel performance (store vs. ecommerce), campaign ROI, repeat buyer rates, AOV, LTV, retention, segment performance, product trends, and executive KPIs.
Who should use Lexer Track Dashboards?
Track benefits marketing teams, ecommerce managers, retail operations, customer service, and executives. Each team gets ready-to-use views tailored to their needs with connected customer data, enabling faster decisions without relying on data analysts or external tools for reporting.