
August 4, 2025
|
2
minute read
Report on new customer insights with Event Tables


We’ve taken one of our most-loved tools—Lexer Event Explorer—and made it even more powerful.
Introducing Event Tables: the next evolution in event analysis, built to help you save, share, and report on customer behavior with ease.
Retailers rely on Lexer’s event data to answer the tough questions—what’s driving purchases, where customers are churning, and how behavior is changing over time. Until now, that analysis lived in the moment. With Event Tables, you can now save, revisit your work, and track change over time, unlocking a whole new layer of visibility and collaboration.
Whether you’re in marketing, ecommerce, or analytics, Lexer Event Tables give you the insights you need, without the heavy lifting.
Turn actions into insight
Every click, purchase, return, and visit your customers make tells a story.
Now, you can track those stories over time. Whether you’re measuring product performance, campaign impact, or channel engagement, Event Tables make it easier than ever to get the answers you need, fast.
- Save event-based analyses for future use
- Drill into any historical timeframe, from last week to last year
- Visualize customer behavior with tables, charts, and time series
- Export your findings in a click to share with your business
Real use cases, real outcomes
Here’s how retail teams are already putting Event Tables to work:
- Uncover product trends: What were your top-selling categories last quarter? Compare sales by store, region, or channel.
- Analyze campaign outcomes: How did last month’s SMS campaign affect return visits from new customers?
- Understand loyalty drivers: What purchase behaviors define your most valuable customers over time?
- Dig into returns: Which SKUs have the highest return rate by persona segment, or store location?
- Track behaviors by segment: Compare first-time buyers vs VIPs, subscription vs one-off purchases, or online vs in-store shoppers—all in a single view.
With flexible filters and historical reach, Event Tables empower marketers, analysts, and ecommerce teams to answer the questions that matter most, without waiting on a data team.
Explore and monitor
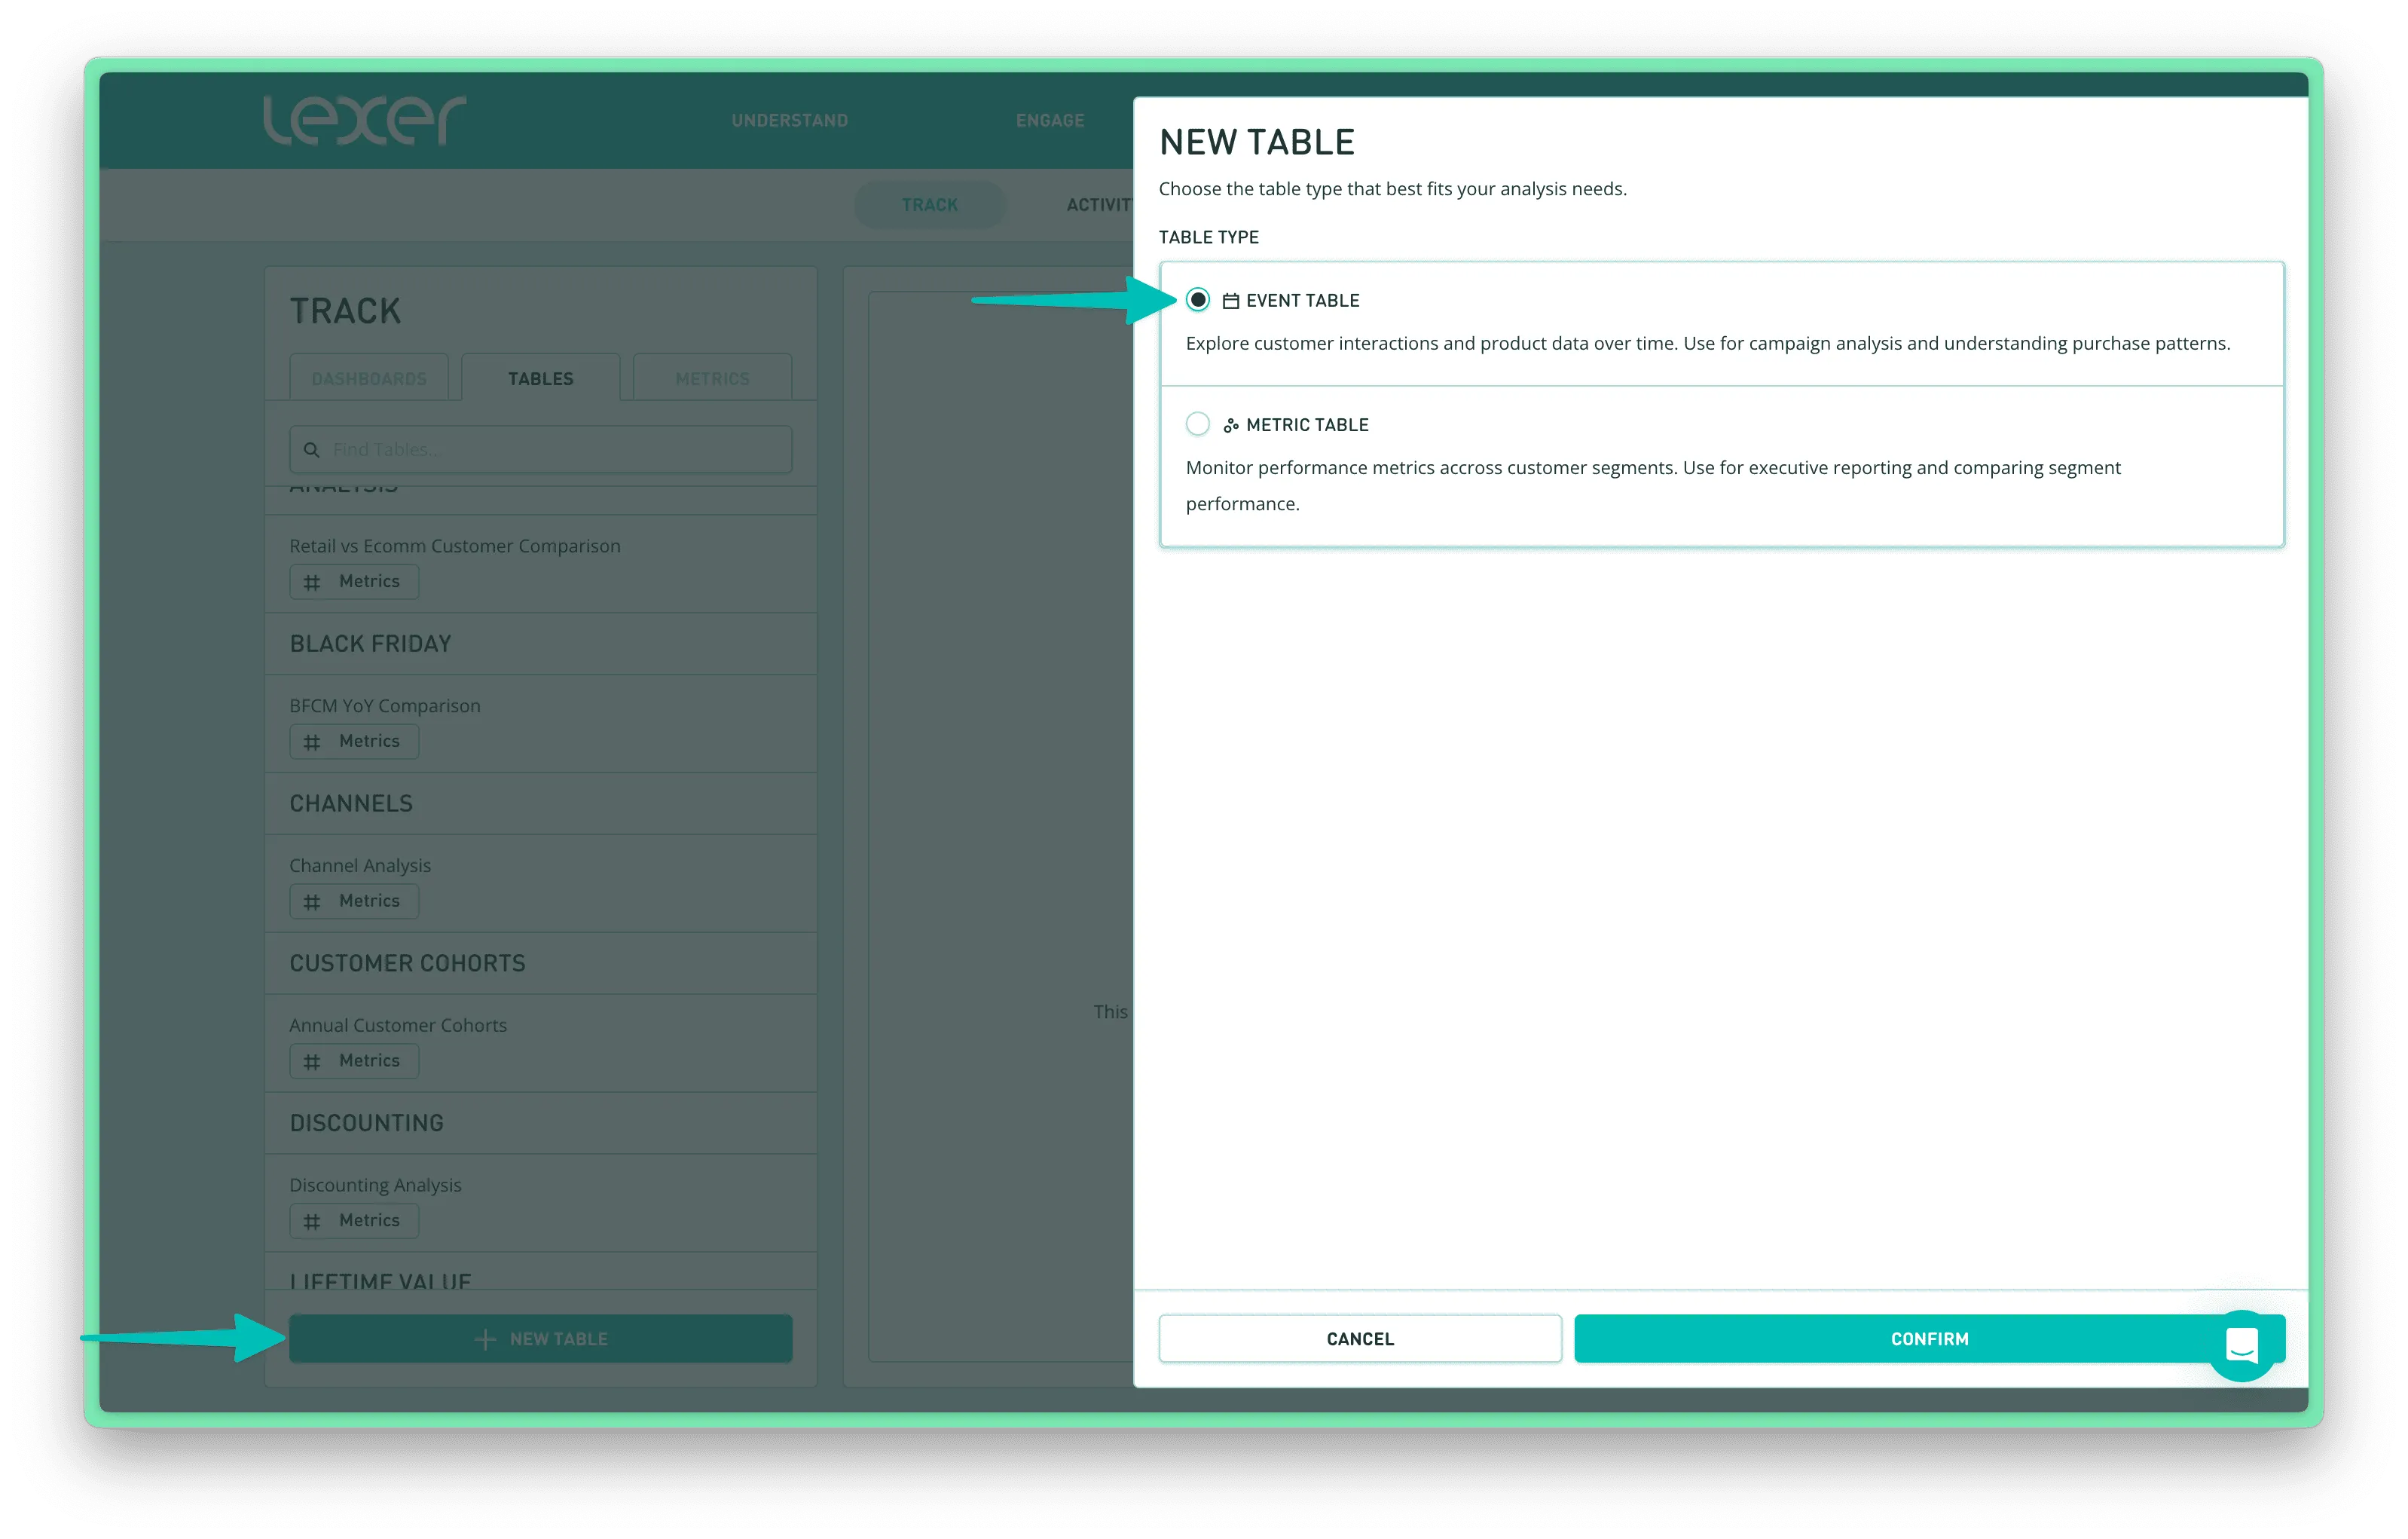
Event Tables live in Lexer Track, right alongside your Metric Tables, with a few key differences:
Use Event Tables:
- Deep-dive into customer behavior across your entire data history
- Analyze campaign impact, product trends, or specific customer actions
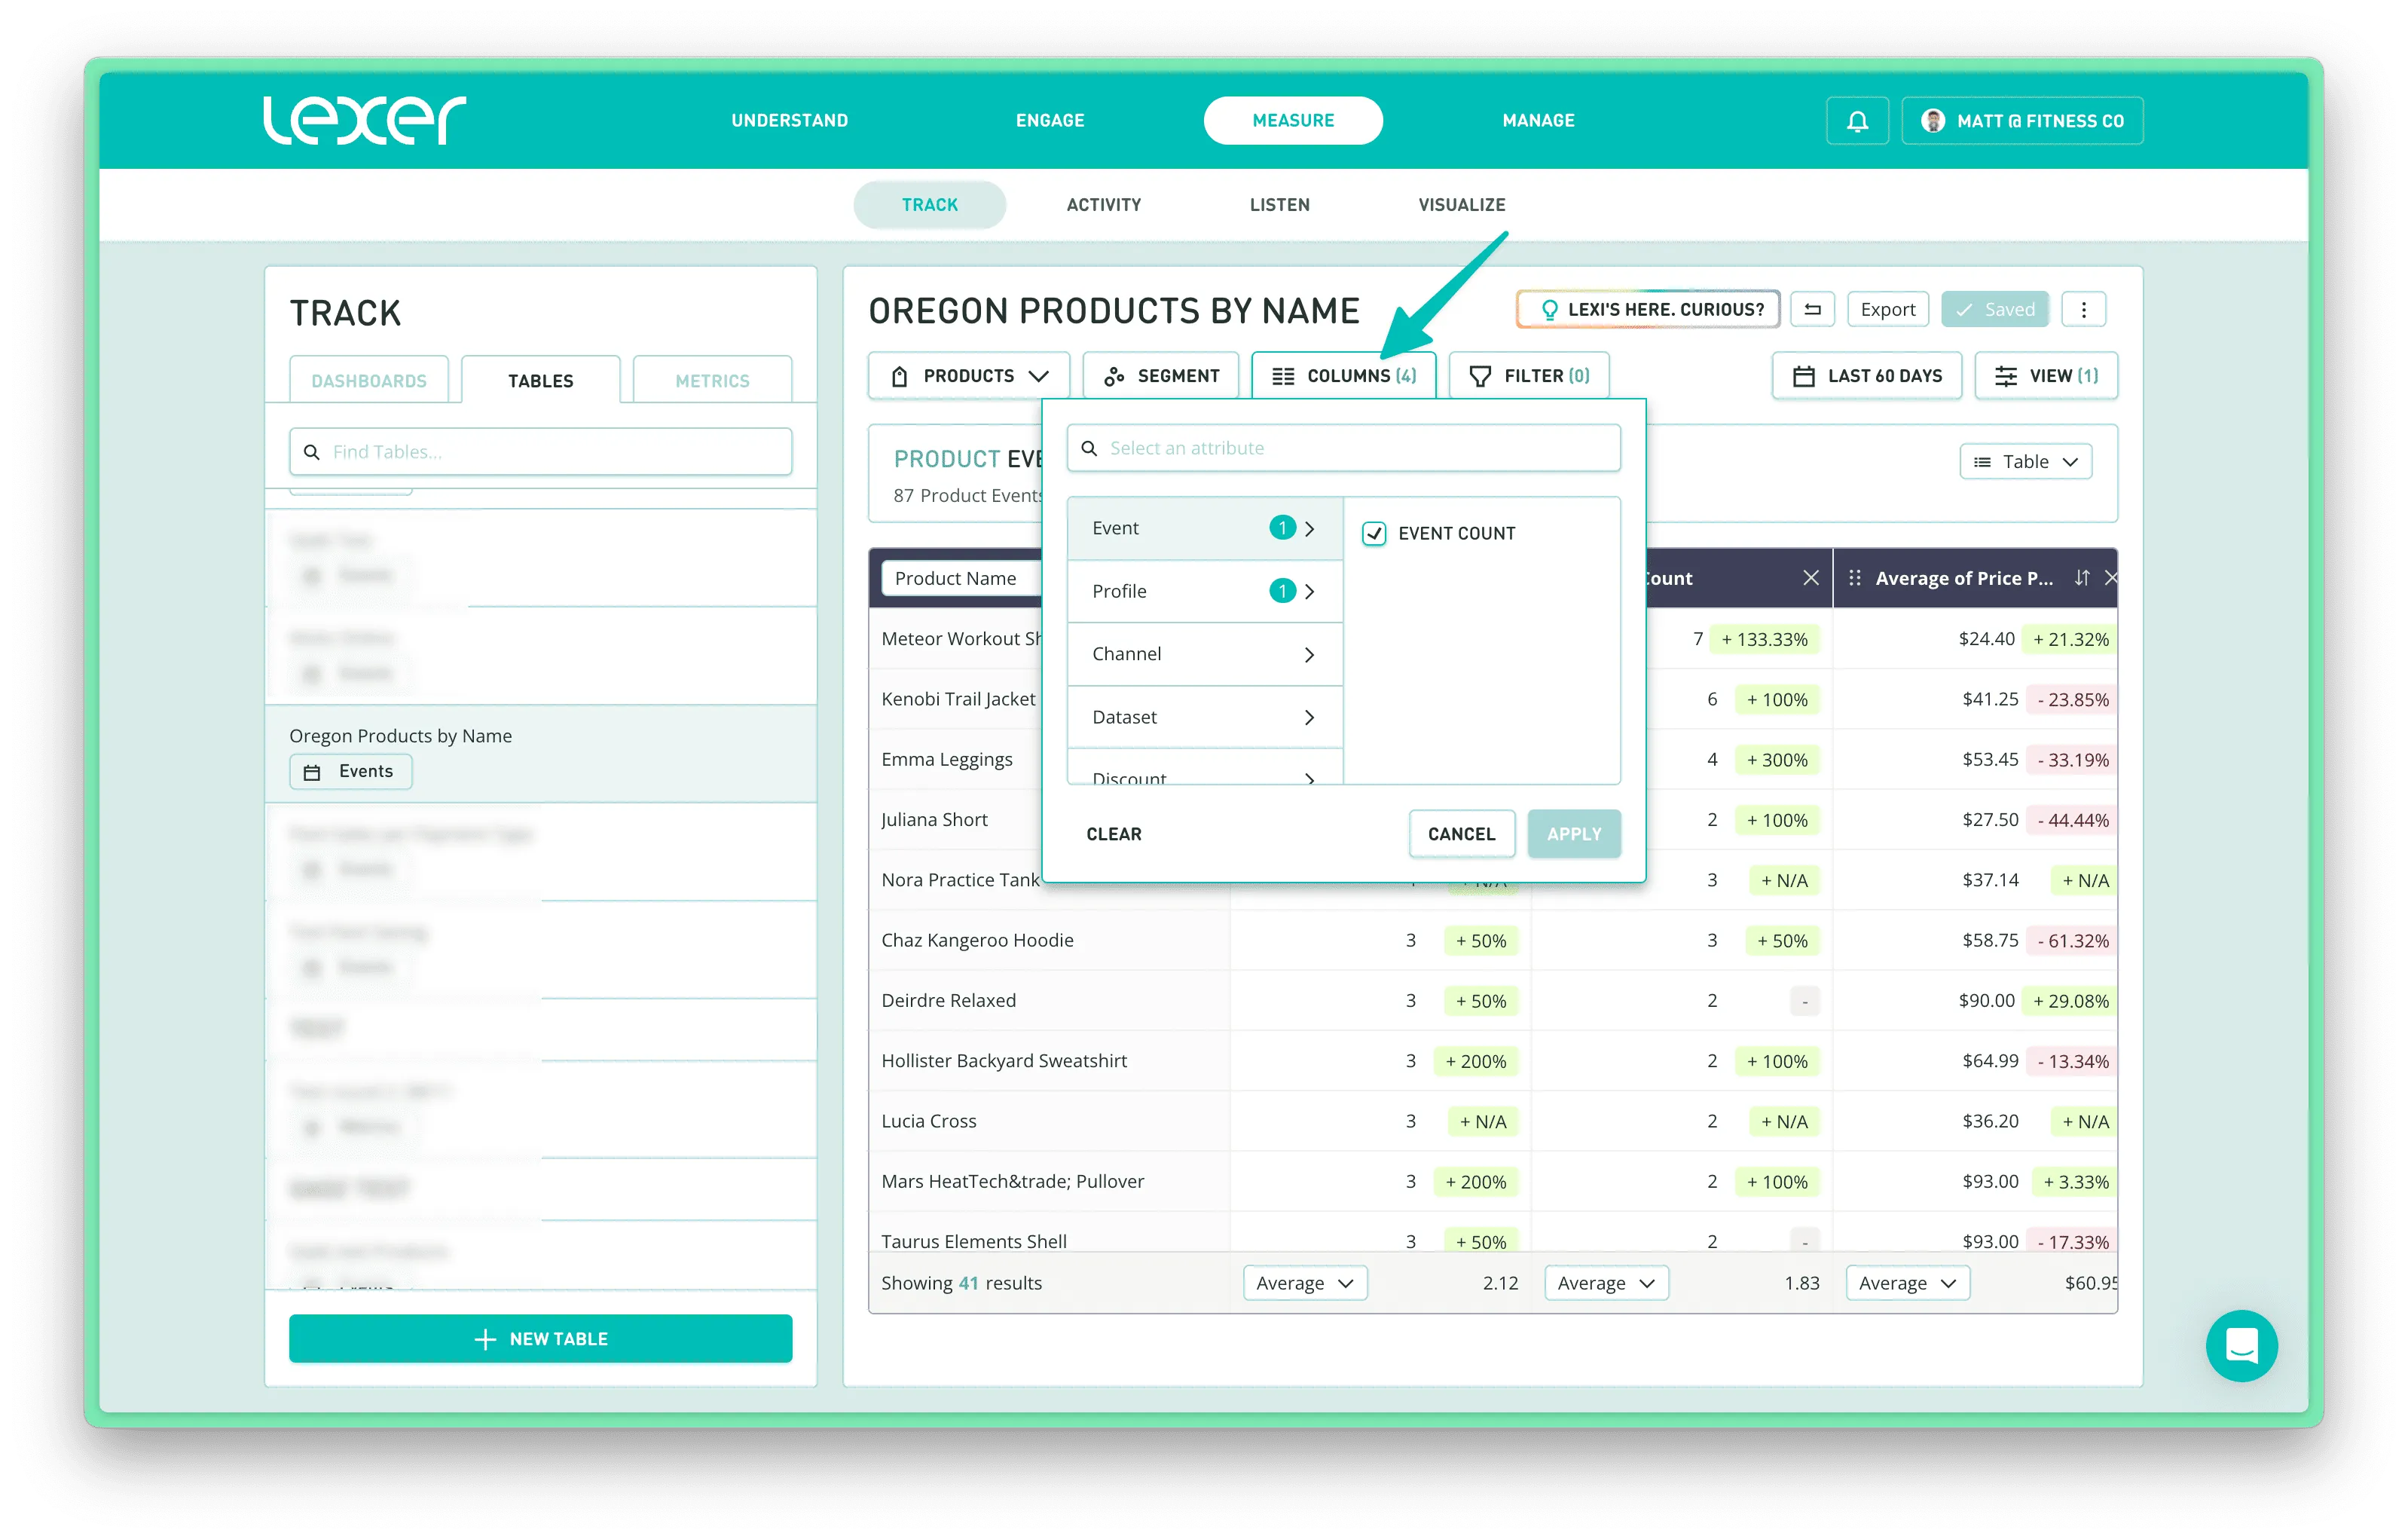
- Filter by customer segments and event-level attributes like payment method, store, or SKU
- Visualize your findings using tables, bar charts, or time series
- Compare detailed metrics side-by-side—like average order value by product category
Use Metric Tables:
- Track key performance indicators over time—like LTV or AOV
- Monitor trends in a single metric, such as weekly VIP revenue
- Power dashboards or recurring reports
- View high-level progress at a glance
- Focus on consistent, forward-looking tracking rather than historical analysis
Together, they give your team the ability to both explore and monitor—from one-off business questions to ongoing performance measurement. Use them in tandem to move from insight to action, faster.
Pick up where you left off
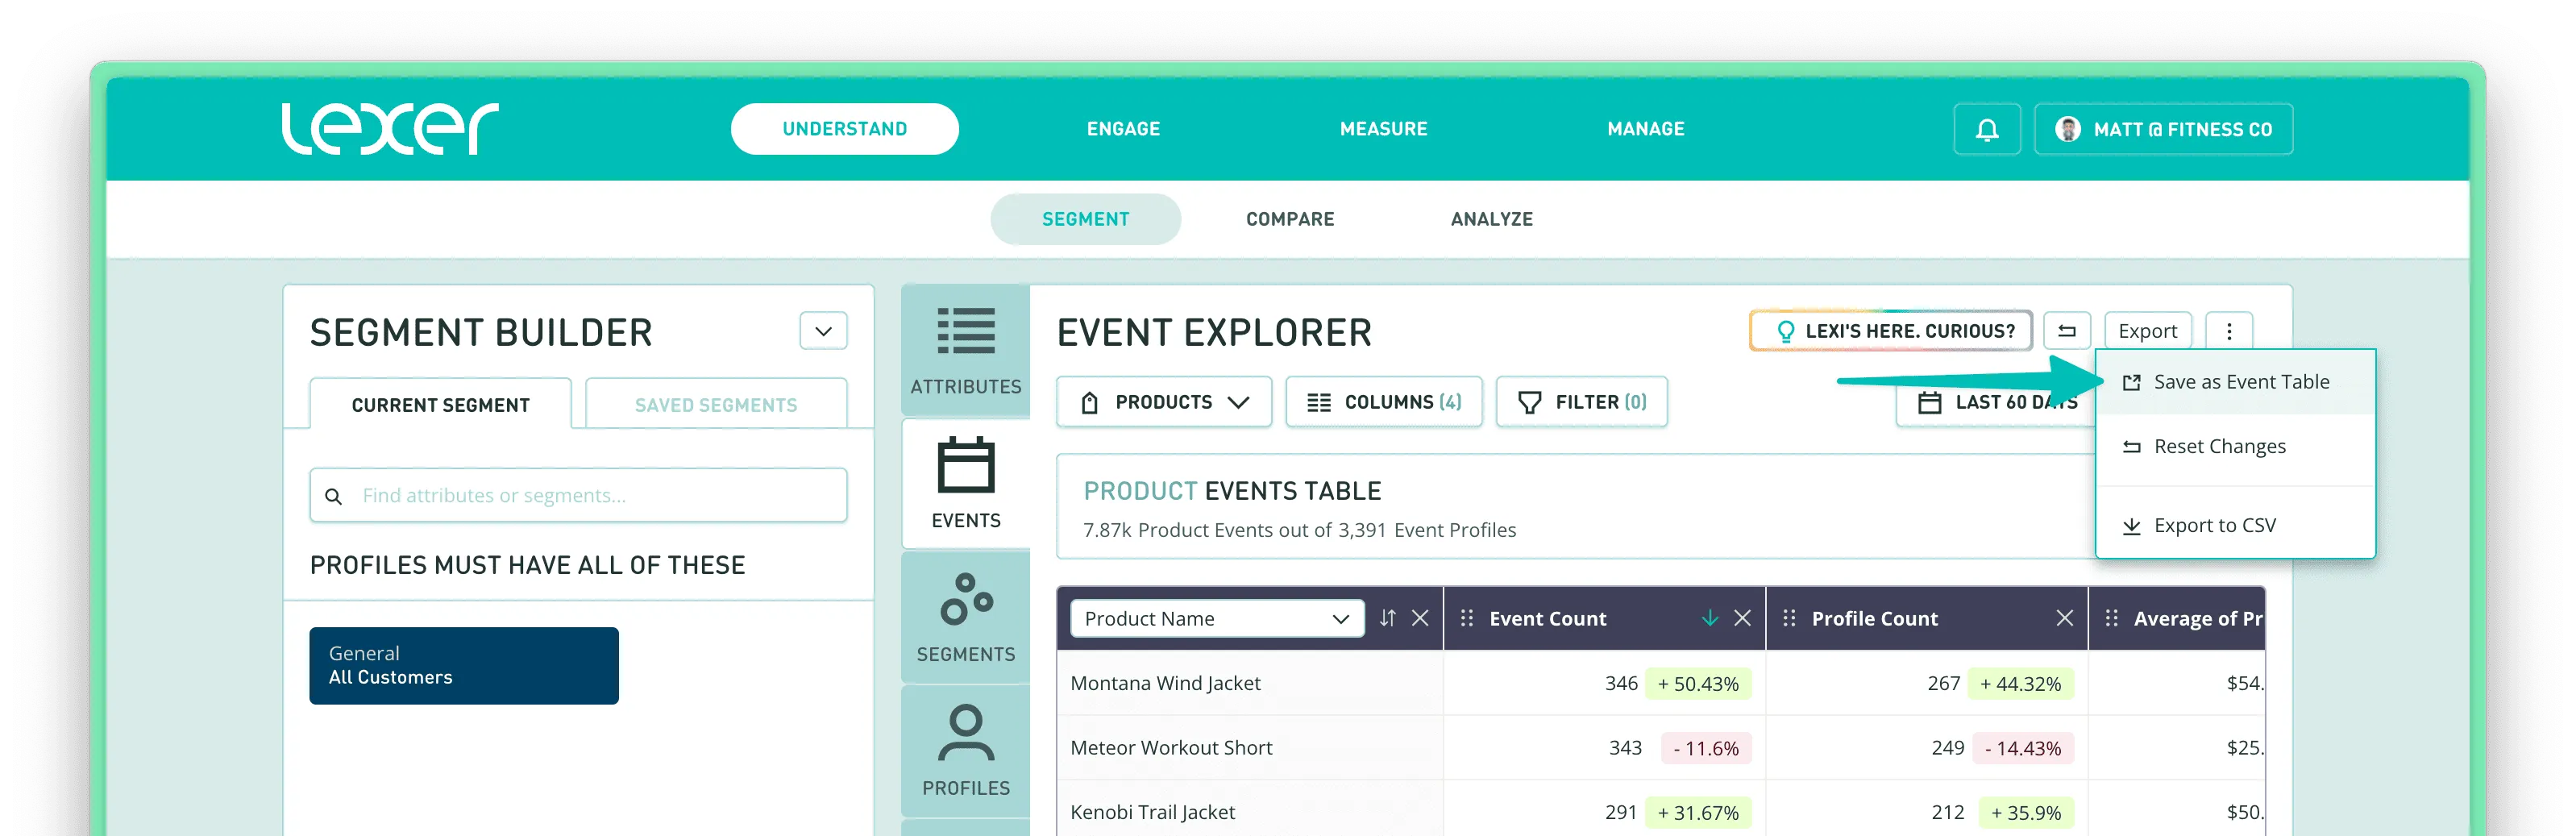
- Create Event Tables directly in Event Explorer or Lexer Track
- Save and return to your setup—filters, segments, and layouts included
- Duplicate tables to create variations for different segments or campaigns
- Export your findings for presentations, reports, or deeper offline analysis
From insight to impact
Retail is fast. Your tools should be too.
With Event Tables, you can explore your full customer history, answer pressing questions on the fly, and build reporting your team will actually use. It’s everything you need to turn raw data into real-world decisions, without the heavy lifting.
Event Tables are available now for all Lexer clients. Start using Event Tables today.