
GUIDES
Customer retention metrics: the numbers retailers should track
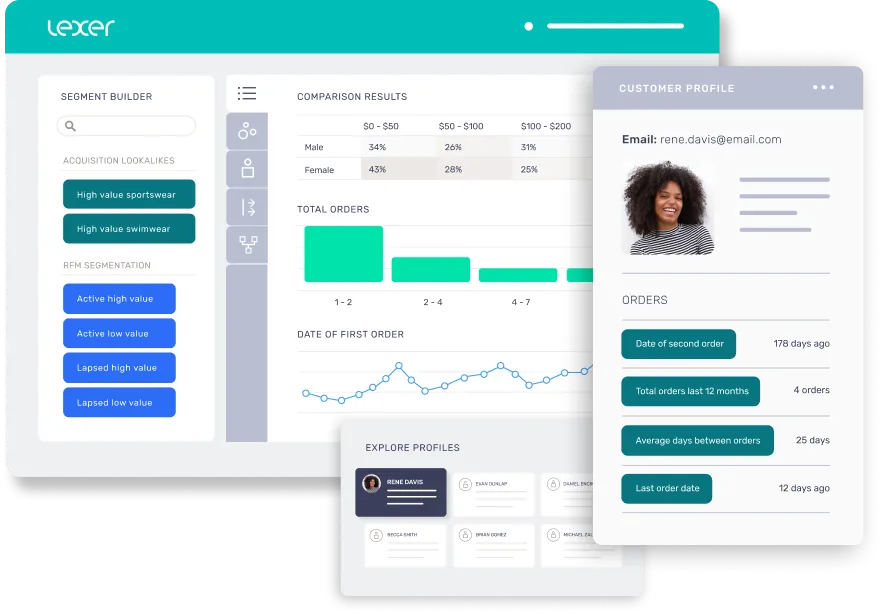
The core retail retention metrics are repeat purchase rate, customer retention rate, churn rate, average purchase frequency, time to second purchase, one-time buyer rate and customer lifetime value. Track them by segment rather than in aggregate, because a blended retention number hides almost everything useful.
The seven metrics, with formulas
Repeat purchase rate
The share of customers who have bought more than once in a period.
Customers with 2 or more orders ÷ total customers, in the period
The most honest single measure of whether a retailer is building a customer base or renting one. Typical ecommerce ranges sit between 20% and 30%, though category matters enormously. A mattress retailer and a coffee roaster should not be compared.
Customer retention rate
The share of customers held from one period to the next.
(Customers at end of period - new customers acquired) ÷ customers at start of period
Customer retention rate is useful for cohort tracking. It's important to note that this metric can be less useful in retail than in subscription businesses, because retail has no cancellation event to anchor it.
Churn rate
In retail, churn is a judgement rather than an observation. The workable definition is behavioural: a customer is churned when the gap since their last purchase exceeds 1.5 to 2 times their own average purchase cycle. Set the multiplier by category and hold it steady, or the number moves for reasons that have nothing to do with customers.
Applying subscription churn logic to retail is the most common measurement error in the category.
Average purchase frequency and purchase cycle
Purchase frequency = total orders ÷ unique customers, in the period Purchase cycle = average days between consecutive orders, per customer
Purchase cycle is the more useful of the two, because it's calculated per customer rather than across the base. It's also what makes a behavioural churn threshold possible.
Time to second purchase
Median days between first and second order. The second purchase is the hinge. Customers who make it are dramatically more likely to make a third, and the window in which it happens tells you when your retention programme should run.
One-time buyer rate
The share of customers who have bought exactly once, ever. This is usually the largest and most ignored group in a retail database. Moving even a small share of it into a second purchase is often worth more than anything a retention programme does for existing repeat buyers, simply because of the size of the pool. If you want to understand more about one-time buyer rates and the value this group of customers can have on your business, have a look at our interactive one-time buyer calculator.
Customer lifetime value
Two versions, and confusing them causes trouble.
Historic LTV is what a customer has already spent, ideally net of cost of goods.
Historic LTV = sum of gross margin across all orders to date
Predicted LTV is a forecast of total value over an expected relationship.
Predicted LTV = average order value × purchase frequency × expected lifespan × gross margin rate
Use historic LTV to rank the customers you have. Use predicted LTV to decide acquisition spend. Reporting revenue-based LTV without margin is the flattering version, and it's the one that leads retailers to over-invest in discount-dependent customers.
Retention rate, repeat purchase rate and LTV are not the same thing
They get used interchangeably, and they measure three different things.
Repeat purchase rate: how many customers came back at all.
Retention rate: how much of the base you held between two points in time.
Lifetime value: what a customer is worth in total.
A retailer can lift repeat purchase rate while LTV falls, if the repeat purchases are heavily discounted. A retailer can hold retention rate steady while the base shrinks, if acquisition has slowed.
Metrics that mislead
Blended retention across the whole base: your VIPs and your one-time discount shoppers have almost nothing in common, so averaging them produces a number that describes no customer accurately.
Revenue per customer without cost of goods: two customers at $500 a year, one at full price and one at 45% off, are not equivalent. However, without product cost you cannot tell them apart.
Email engagement as a retention proxy: opens and clicks measure interest in your emails, but not whether someone will buy.
Retention measured over a fixed calendar window: a 12-month window flatters categories with long purchase cycles and punishes categories with short ones. Measure against each customer's own cycle instead.
Measure by segment
The useful cut is by value and behaviour together. At minimum, split by:
- First-time versus repeat
- Full-price versus discount-dependent
- Acquisition channel
- First product or category purchased
- Online, in store, or both
That last split is usually the most revealing, and the one most retailers cannot produce, because it needs in-store purchases attached to known customers.
Where Lexi fits
Lexi holds the unified customer record and the product cost data in one place, so gross margin per customer, discount dependency and purchase cycle are available without anyone exporting a CSV. Ask a question in plain language and Lexi builds the answer, shows the calculation behind it, then builds the matching segment and pushes it to your sending tools. Every figure traces back to a real calculation, so a number you take into a board meeting can be opened up and checked.
A reporting cadence that works
Weekly: one-time buyer count, time to second purchase for the most recent cohort.
Monthly: repeat purchase rate and churn by segment, gross margin per customer.
Quarterly: predicted LTV by acquisition channel and by first category, retention by cohort.
Related Articles
📄 Customer Data Platform (CDP)
📄 Customer Intelligence Platform
📄 Retail Data Analytics Solutions
📄 Customer Experience in Retail