
March 23, 2026
|
7
minute read
RFM analysis for retailers: a practical guide to prioritising marketing investment


Most retention budgets treat all customers equally. RFM analysis is the framework that tells you who actually deserves your investment, and who you've been overspending on.
Your retention budget is finite. Your customer base isn't. Without a structured way to assess who's buying, how often, and how much, marketing teams tend to default to one of two approaches: broadcast everything to the full list, or focus on acquisition and hope existing customers look after themselves. Neither is efficient, and both leave measurable revenue on the table.
RFM analysis, built on three variables (recency, frequency, and monetary value), gives you a replicable framework for segmenting your customer base by actual behaviour. It tells you who your Champions are, who is slipping, who is worth re-engaging, and who has already left. More importantly, it tells you how to allocate budget across all of them.
McKinsey research consistently shows that companies excelling at personalisation generate 40% more revenue from those activities than their slower-growing counterparts. RFM segmentation is the mechanism that makes personalisation at scale possible for retail marketers.
What RFM analysis is (and why retail marketers should care)
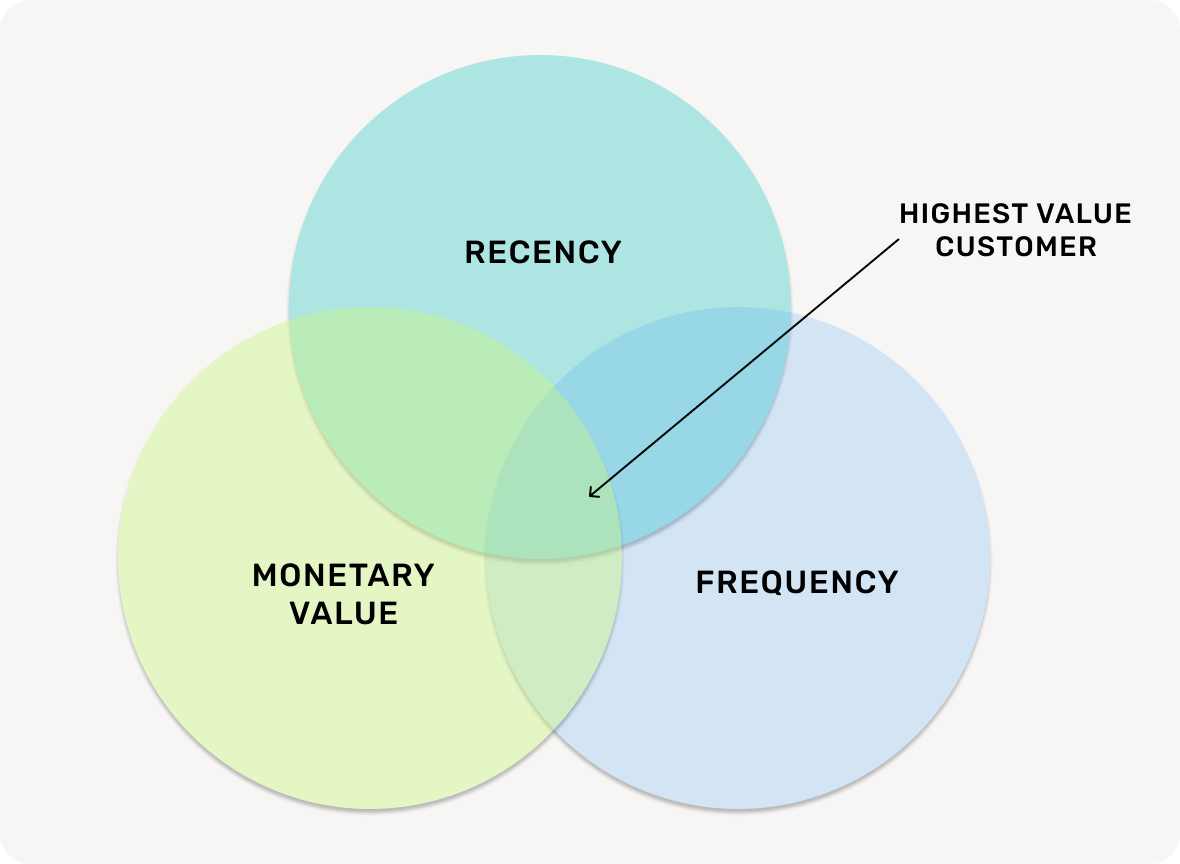
RFM stands for recency, frequency, and monetary value. Each variable measures a different dimension of customer behaviour:
- Recency: how recently a customer made a purchase. A customer who bought last week behaves very differently from one who bought 18 months ago.
- Frequency: how many times a customer has purchased within a given period. High-frequency buyers signal loyalty and product-market fit.
- Monetary value: how much a customer has spent in total, or on average per transaction. This identifies your highest-revenue contributors.
Scoring customers across these three dimensions creates a multidimensional view of your base. Rather than ranking everyone by total spend and calling the top 20% "VIPs," RFM surfaces nuance. A customer with high monetary value but declining recency is a very different strategic risk from a high-frequency, moderate-spend buyer who purchased two days ago.
For retail brands specifically, RFM analysis is valuable because purchase cycles vary significantly across categories, channels, and seasonal patterns. A fashion retailer with strong seasonal peaks will see recency scores compress around sale periods.RFM accounts for this by measuring relative behaviour within your own customer base, not against external benchmarks.
What this looks like in practice: Score each customer 1 to 5 on each RFM dimension, then combine those scores into a composite. A customer scoring 5-5-5 is a Champion (purchased recently, purchases often, high spend). A customer scoring 1-1-1 has already left in every meaningful sense. The segments in between are where your strategic decisions get interesting.
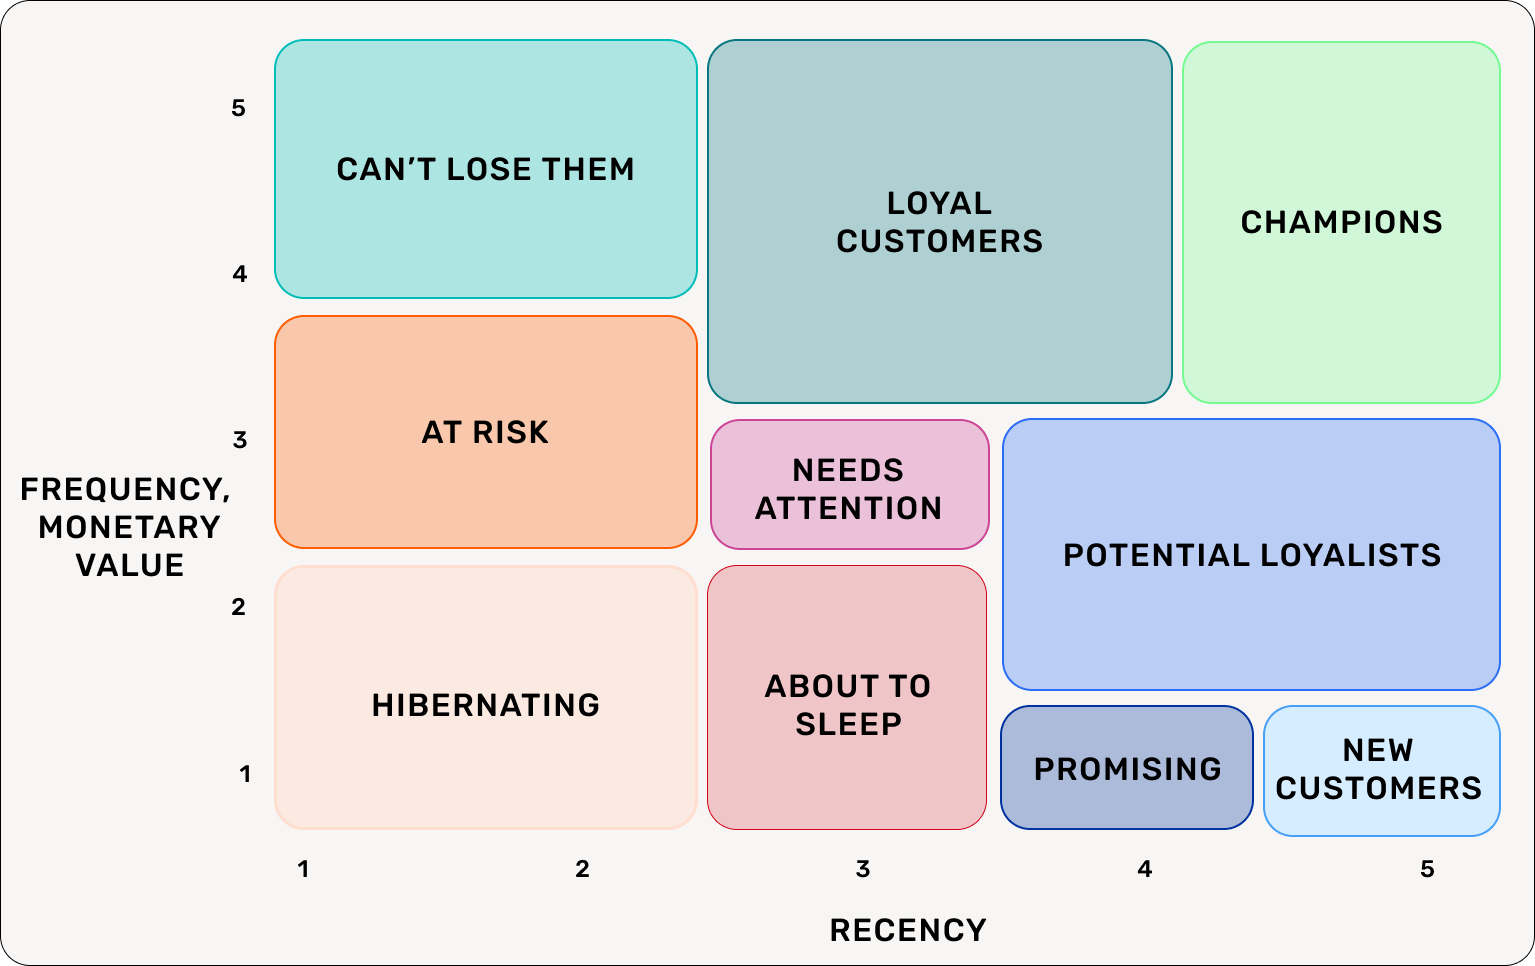
How to read your RFM grid: the six segments that matter most
Once you score your base, customers fall into recognisable clusters. These are not rigid categories; every RFM implementation produces slightly different distributions depending on your category, purchase frequency, and seasonal patterns. But these six segments capture the most strategically significant groups for retail marketers.
Champions (high R, high F, high M)
Your best customers. They buy often, they bought recently, and they spend the most. Champions respond well to early access, exclusive offers, and loyalty recognition. They are also your best source of word-of-mouth and referrals. The risk with this segment is not churn, but rather taking them for granted.
Loyal Customers (high F, moderate to high M, moderate R)
These customers purchase frequently but may not be at peak recency. They know your brand, trust your product, and return without heavy discounting. Investment here pays off through loyalty programme enrolment and category expansion.
Potential Loyalists (high R, low to moderate F)
Recent buyers who have not yet established a consistent pattern. These customers are in the critical window between first and second purchase. The right campaign here — timed correctly, relevant to their first purchase — converts a one-time buyer into a repeat customer. This is one of the highest-leverage segments in your entire base.
At-Risk Customers (low to moderate R, high F and M historically)
Customers who used to behave like Champions or Loyal Customers but have started to pull back. Recency has dropped while historical frequency and spend remain high. This segment has the highest win-back ROI because the relationship already exists. You just need to re-engage it before it lapses entirely.
Hibernating (low R, moderate F and M)
These customers purchased a handful of times but have not returned in a meaningful period. Re-engagement is possible, but requires a more compelling reason to return than standard communications. Category relevance and personalised incentives matter here.
Lost (low across all three)
Customers who scored low on every dimension. Re-engagement campaigns targeting this group tend to perform poorly on a cost-per-reactivation basis. Budget directed here is usually better redirected toward Potential Loyalists or At-Risk segments.
Lexer's segmentation platform automatically calculates RFM scores and visualises them as a distribution grid, so you can see the size, spend, and trajectory of each segment without building the model manually.
What to actually do with each segment
Knowing your RFM segments is the starting point. Acting on them is where the return comes in. Here is a segment-by-segment action framework.
- Champions: Prioritise recognition over promotion. Early product access and VIP experiences build emotional loyalty without margin erosion. This is also the right segment to activate for referral programmes and loyalty programme enrolment.
- Loyal Customers: Focus on deepening the relationship. Category expansion campaigns (surfacing product lines adjacent to their purchase history) increase basket size without acquisition cost. SHEIKE's loyalty programme, SHEIKE Society, was built around exactly this principle. Rather than defaulting to generic points-per-purchase mechanics, the programme was designed around experience and recognition for customers already displaying loyal behaviour. It was named a finalist in the 2026 Asia Pacific Loyalty Awards for Best Loyalty Program Launch, which was a direct result of building the programme around data-verified behavioural segments, not assumptions.
- Potential Loyalists: Trigger the second purchase. Time your next communication to when the category naturally suggests a return visit. If a customer bought a jacket, when will they need another layer? What else did buyers of that product purchase next? Behavioural data answers this question. A timely, relevant second-purchase campaign converts this segment at significantly higher rates than a standard newsletter send.
- At-Risk Customers: Move urgently. The longer this segment sits without re-engagement, the harder and more expensive the win-back becomes. Personalised campaigns referencing their previous purchase history, combined with a clear reason to return, outperform generic win-back offers on both conversion rate and reactivation cost.
- Hibernating: Segment within the segment. Not all hibernating customers carry the same potential. Customers who purchased multiple times before going quiet are worth more re-engagement effort than single-purchase hibernators. Build sub-segments and test personalised re-engagement against suppression to determine true reactivation potential before committing budget.
- Lost: Suppress from active campaigns and redirect budget. Run a small holdout test to measure organic reactivation, which gives you a baseline for incremental lift calculations — then redirect remaining spend where it returns more.
How to build RFM campaigns that actually move the needle
Knowing which segment gets which message is only half the equation. Campaign construction matters too.
Match communication frequency to segment value. Champions and Loyal Customers tolerate more frequent communication without unsubscribing. At-Risk and Hibernating segments are more sensitive to over-communication, which can accelerate churn rather than prevent it. Frequency caps by RFM tier reduce unsubscribes while improving overall programme deliverability.
Personalise the offer, not just the subject line. Inserting a first name is not personalisation. RFM-informed campaigns use purchase history, category affinity, and spend level to surface relevant products. Customers in high-monetary segments respond better to quality and exclusivity signals than to discount offers.
Time campaigns to purchase cycles. Recency scores naturally cluster around purchase windows. Mountain Khakis, an outdoor apparel retailer, used seasonal campaign timing aligned to customer purchase history to drive significant performance improvements during Black Friday and win-back periods. The insight was straightforward: different customers have different seasonal rhythms, and timing communications to match those rhythms outperforms fixed calendar sends.
Test suppression as a strategy. For Lost and Hibernating segments, removing them from standard broadcast campaigns often improves overall programme metrics because you are no longer diluting results with unengaged contacts. Suppression is not giving up on customers; it is directing budget toward segments that will return it.
Lexer's analysis tools include pre-built RFM distribution charts that show how Champions, At-Risk, and Loyal Customers are trending over time, and whether your campaigns are actually moving customers up the grid or simply maintaining the status quo.
The most common RFM mistakes retailers make
Treating all lapsed customers the same. A customer who last purchased 13 months ago is categorically different from one who last purchased 13 months ago and previously bought 15 times. Recency without frequency context produces blunt segmentation that misallocates budget in both directions.
Using monetary value in isolation. High spend does not automatically signal high loyalty. A customer who made one large purchase during a sale and never returned is not the same as a moderate-spend customer who buys every six weeks. Composite scoring prevents this misclassification.
Setting thresholds arbitrarily. "Top 20% by spend" sounds reasonable until you realise your spend distribution is skewed by a handful of outlier purchases. Thresholds should be set by analysing natural breaks in your actual data, not by applying generic percentiles borrowed from industry guides.
Rebuilding segments manually each month. RFM analysis is only useful if it's current. Customers who were At-Risk last month may have converted, churned, or returned by now. Static lists built on monthly exports go stale within days. Dynamic segments that update as behaviour changes are the practical solution.
Ignoring the channel dimension. An omnichannel retailer's RFM data needs to account for both in-store and online behaviour. A customer who buys in-store every month but never transacts online will appear as Hibernating in an ecommerce-only data view, and get incorrectly targeted with re-engagement campaigns. True RFM accuracy requires unified data across all purchase channels.
How to run RFM analysis without a dedicated analyst
The traditional approach to RFM involves exporting transaction data, cleaning it in a spreadsheet, scoring it manually, building segment lists, and uploading them to your email platform. This process takes hours of analyst time and produces outputs that are partially out of date before the first campaign launches.
Modern CDPs remove this dependency entirely. Rather than treating RFM as a periodic project, they calculate scores continuously from live transaction data. Segments update automatically as customer behaviour changes. Campaigns can be triggered the moment a customer's score shifts — when an At-Risk customer crosses into Hibernating, or when a Potential Loyalist completes their second purchase.
Lexer's reporting dashboard visualises RFM distribution across your entire customer base, tracks how segments shift over time, and integrates with email, SMS, and paid platforms so you can activate against RFM segments without manual exports or platform-by-platform uploads. For CRM managers and Heads of Marketing running multiple campaigns across multiple channels, this is the difference between RFM as a quarterly exercise and RFM as a live operational capability.
RFM analysis is not a complicated framework. The complexity lies in consistently applying it: maintaining current scores, building campaigns against each tier, and resisting the temptation to collapse your segmentation into a single "best customers" list and consider the job done.
The retailers seeing the strongest retention results treat RFM as infrastructure rather than a project. They know, at any point in time, how many customers are Champions, how many are At-Risk, and what is actively being done about each group. That visibility drives better budget decisions, more efficient spend, and retention results that compound over time.
Book a demo to see how Lexer's RFM segmentation and analysis tools help retail marketing teams prioritise investment across their full customer base, without the analyst dependency.