
June 23, 2026
|
5
minute read
Customer retention strategies for retail: a complete guide


Most retailers lose more customers than they realise, and spend more acquiring replacements than they need to. Customer retention is where retail profitability is built or eroded. This guide covers the frameworks, data requirements, and practical strategies for building a retention programme that compounds over time.
What customer retention means in retail data
Customer retention in retail is the percentage of customers who make at least one purchase within a defined period after their previous purchase. It is not the same as the average across all customers, which masks the difference between segments that are highly retained (VIPs, loyalists) and segments that are structurally lapsing (single-purchase buyers, seasonally acquired customers).
A retained customer is one who continues to buy from you. Their lifetime value accumulates with each purchase. A lapsed customer is one who has stopped, and the cost of reactivating them, in discount spend and communication frequency, is significantly higher than the cost of preventing the lapse in the first place.
Research by Frederick Reichheld of Bain & Company, cited in Harvard Business Review, shows that a 5% improvement in customer retention rates produces a 25 to 95% increase in profits. The range reflects differences in category, margin structure, and starting retention rate, but the mechanism is consistent: retained customers buy more often, spend more over time, and cost less to serve per transaction.
For most retailers, the most important retention metric is not aggregate churn rate. It is retention rate by segment, specifically by value tier, because the financial impact of a lapsed high-CLV customer is orders of magnitude greater than the financial impact of a lapsed single-purchase buyer.
The RFM Retention Matrix: how to segment customers by retention risk
The RFM Retention Matrix is a framework for classifying customers by their proximity to lapsing, using three behavioural dimensions: Recency (how recently they purchased), Frequency (how often they buy), and Monetary value (how much they spend).
Each dimension produces a score, and the combination of scores places each customer in a matrix cell that defines both their current value and their retention risk. The matrix has four commercially significant segments:
Active High-Value (High R, High F, High M): These are your best customers. They are buying recently, often, and at high value. Retention strategies for this group focus on recognition, early access, and VIP experiences that create switching cost through relationship, not just habit.
At-Risk High-Value (Low R, High F, High M): These are customers who have historically been your best buyers but have not purchased recently. Their lapse is a significant financial event. These customers require a distinct, higher-effort retention programme with more personalised intervention.
Active Low-Value (High R, Low F, Low M): These are customers who buy regularly but at low frequency or low value. They are retained in the functional sense but have not yet demonstrated the buying behaviour associated with long-term loyalty. First-to-second purchase programmes and category cross-sell are the primary strategies here.
Lapsed (Low R, Low F): These are customers who have exceeded their expected repurchase window without returning. Standard win-back sequences apply, though the conversion rate is lower than for pre-lapse intervention. Suppressing lapsed customers from acquisition audiences is an immediate cost saving regardless of reactivation outcome.
A customer segmentation platform that runs RFM analysis across your full customer database produces these segment assignments automatically, refreshing them as purchase behaviour changes. The matrix is not a one-time snapshot; it is a continuously updated view of your retention landscape.
.png)
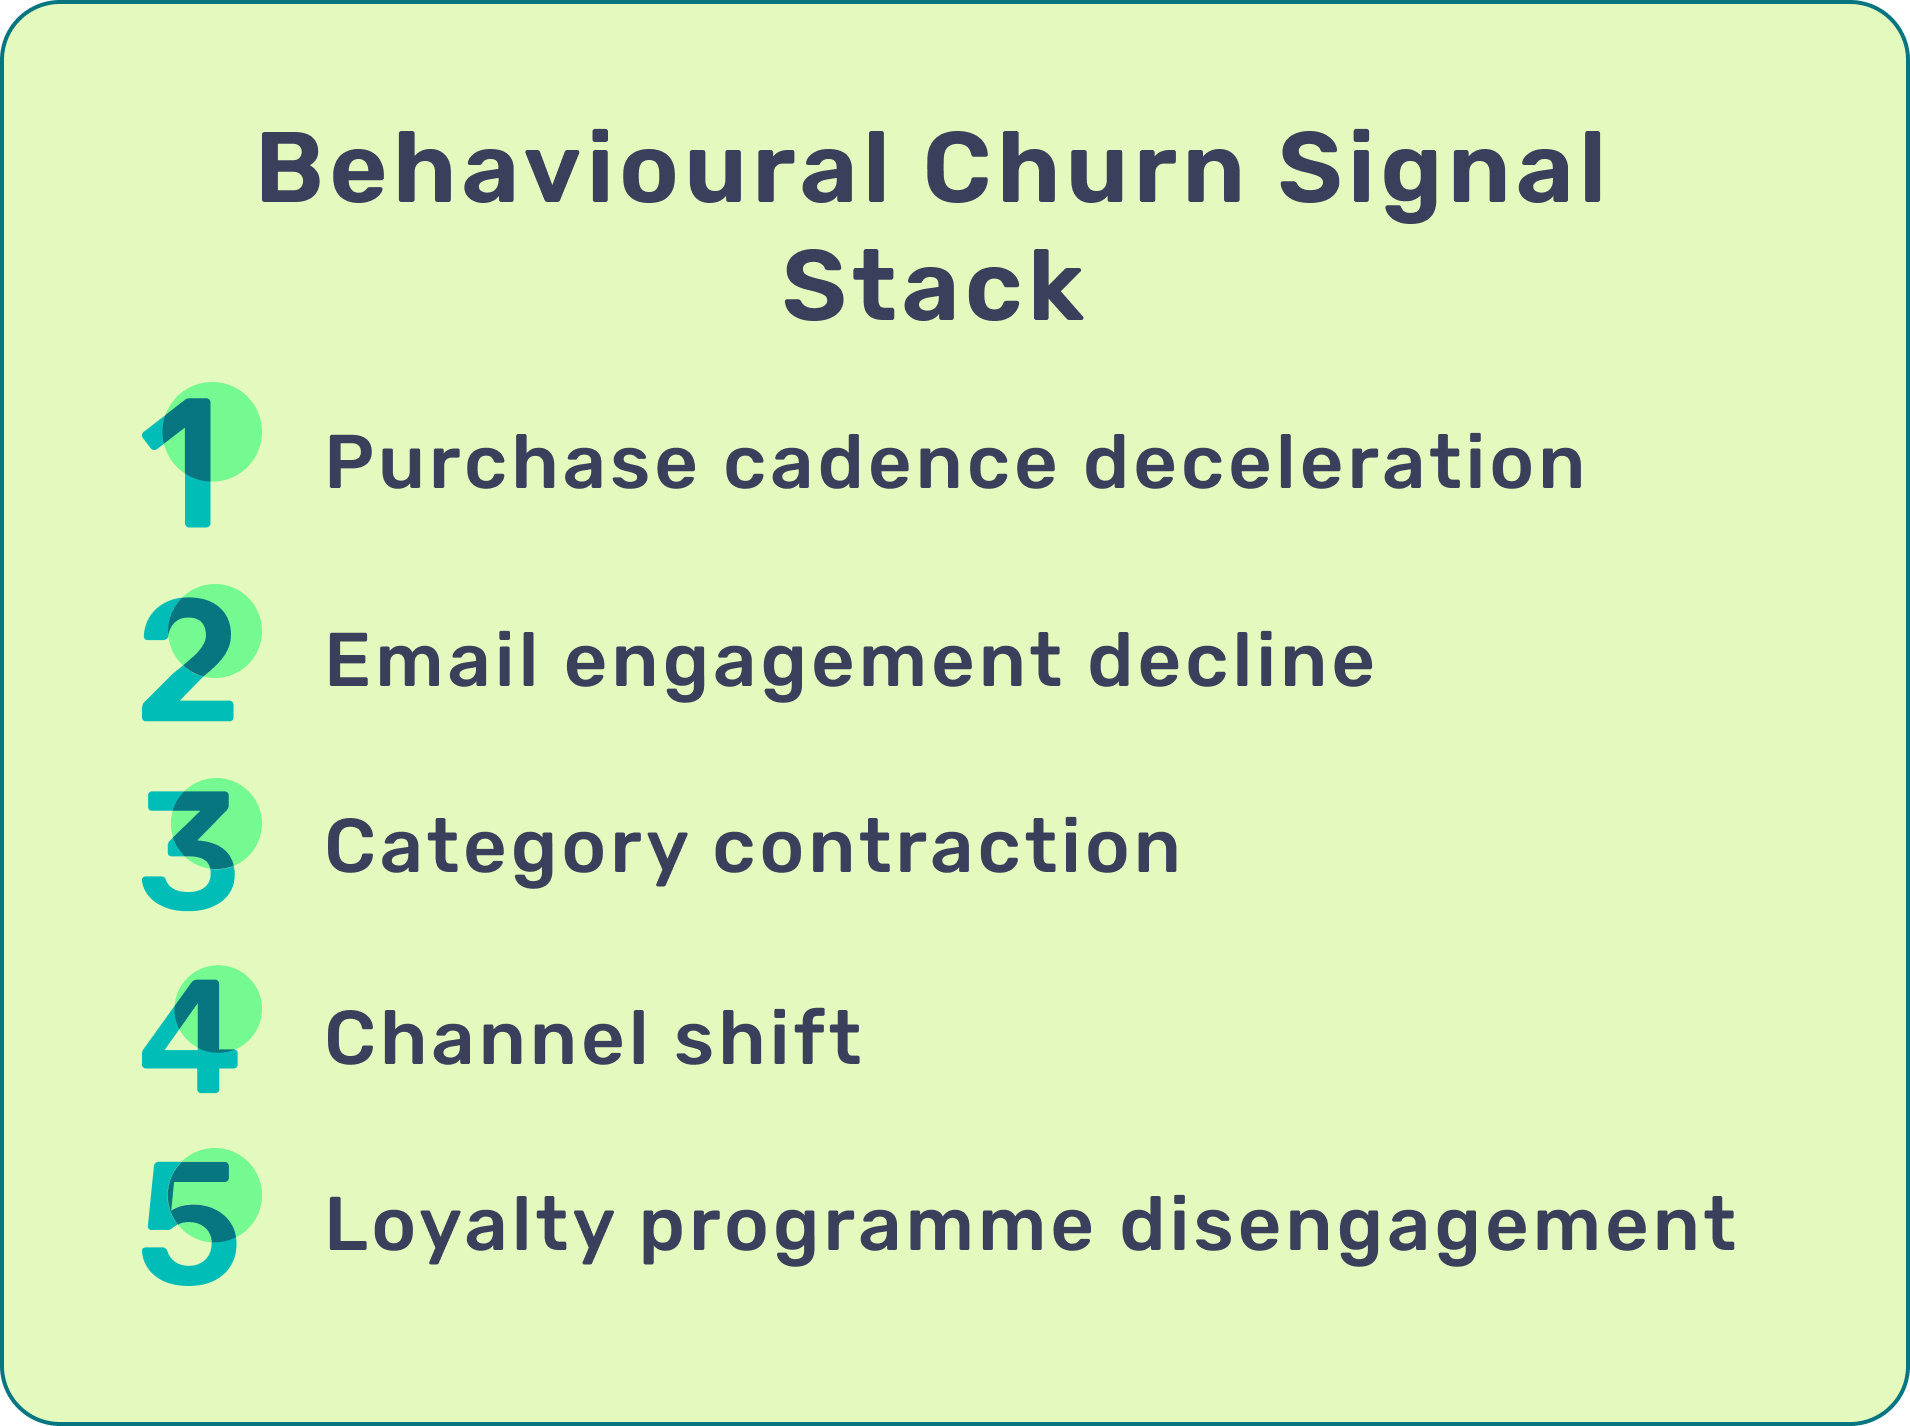
The Behavioural Churn Signal Stack: 5 pre-churn signals to detect before lapsing occurs
The Behavioural Churn Signal Stack is a framework for identifying customers who are trending toward lapsing before they actually cross the threshold. Each signal is observable in unified customer data before a customer stops purchasing.
Signal 1: Purchase cadence deceleration. A customer who typically buys every 45 days and has not purchased in 60 days is showing early cadence deceleration. This is the primary signal. The threshold varies by category and customer, but a 30 to 50% extension beyond a customer's typical repurchase window is a reliable early warning indicator.
Signal 2: Email engagement decline. Open and click rates that drop significantly over a 60-day window, while the customer is still within their normal repurchase window, indicate that the relationship is cooling before the purchase behaviour reflects it. Email disengagement typically precedes purchase lapsing by 4 to 8 weeks.
Signal 3: Category contraction. A customer who previously bought across multiple categories and returns to a single category, or reduces their category range, is showing a narrowing of brand relationship. Breadth of category engagement is one of the strongest predictors of long-term retention.
Signal 4: Channel shift. For omnichannel retailers, a customer who moves from in-store to online-only buying (or vice versa) is often responding to a service or experience issue. Channel shift that occurs without an obvious external trigger (house move, change of location) is worth investigating.
Signal 5: Loyalty programme disengagement. A customer who stops redeeming loyalty points, or allows points to accumulate without redemption, is showing reduced programme engagement. For customers who were previously active redeemers, this is a meaningful signal.
A customer data and analytics platform that surfaces these signals at the individual customer level, rather than as aggregate trend data, allows retention interventions to be triggered at the right moment for each customer rather than on a calendar cadence.
Retention strategies by customer value tier
Retention programmes that treat all customers the same produce average results. The most effective retention strategies are differentiated by value tier because the financial return on retention investment varies dramatically across segments.
High-value customer retention (Top 20% by lifetime spend)
High-value customers do not respond well to discount-led retention. For this group, the primary retention driver is recognition and relationship. Strategies that work: early access to new product launches, personalised outreach from a named person (for brands with a clienteling capability), exclusive loyalty tier benefits, and priority service. The goal is to make this customer feel that their relationship with your brand is materially different from the one they would have with a competitor.
McKinsey's Next in Personalization 2021 report shows that personalisation most often drives a 10 to 15% revenue lift, with company-specific lift ranging from 5 to 25% depending on execution maturity. For high-value customers, the revenue impact of personalised retention communication is at the top of that range because the starting value is higher.
Mid-value customer retention (21st to 60th percentile by lifetime spend)
Mid-value customers are where the largest revenue growth opportunity often sits. These are customers who buy regularly but have not yet demonstrated the frequency or category breadth of your top tier. For this group, the primary retention driver is habit formation: increasing purchase frequency and expanding category engagement.
Post-purchase category cross-sell sequences, replenishment reminders timed to each customer's actual purchase cadence, and loyalty point accumulation programmes that reward frequency all work well here. According to data from Smile.io, based on a sample of over 1.1 billion shoppers across 250,000 ecommerce brands, a customer who has made one purchase has a 27% chance of returning for a second. That probability rises to 49% after a second purchase and 62% after a third. The most important thing you can do for a mid-value customer is get them to their next purchase.
At-risk first-purchase customers
Customers who have made one purchase and are approaching the end of their expected repurchase window without returning represent a critical retention window. For this group, the post-purchase sequence is the entire retention programme. A well-structured sequence that includes a product care or use guide, a category cross-sell, and a repurchase prompt timed to their first-purchase category's typical repurchase window converts a single-purchase customer into a repeat buyer at meaningfully higher rates than a generic follow-up.
CALECIM®, a premium skincare brand, applied this exact approach to their customer base. With 75% of their customers inactive or lapsed, they used Lexer's segmentation to build personalised, behaviour-triggered email sequences targeting at-risk and lapsed customers. The result was a 31% increase in repeat sales within six months.
How to measure retention at the segment level
Aggregate churn rate tells you almost nothing useful about where to focus retention investment. Segment-level retention measurement tells you which groups are stable, which are deteriorating, and where intervention would have the highest return.
The four metrics that matter at the segment level are:
Cohort retention rate: What percentage of customers acquired in a specific period (by month, by acquisition source, or by first-purchase category) are still active 12 months later? Cohort analysis reveals whether retention is improving or worsening over time, and which acquisition cohorts have the best long-term value.
Second-purchase conversion rate: Of all first-time buyers, what percentage made a second purchase within 90, 120, and 180 days? This metric is the leading indicator of long-term retention because, as the Smile.io data shows, getting a customer to a second purchase is the single most important retention event.
Days between purchases (by segment): The average time between purchases for each RFM segment. This is the baseline that defines what "at-risk" means for each group, because a high-frequency buyer who hasn't purchased in 30 days is more at-risk than a low-frequency buyer who hasn't purchased in 60 days.
Revenue at risk (pre-lapse segment): The total lifetime value of customers currently in your pre-lapse segment. This is the number that creates internal urgency for retention investment. When the CFO sees that $X million in customer revenue is in the at-risk bucket this quarter, the business case for retention programmes becomes self-evident.
A customer reporting platform built on a unified customer database produces these metrics at the segment level continuously, so retention performance is visible in real time rather than in retrospective reports.
Frequently asked questions
What are the best customer retention strategies for retail?
The most effective customer retention strategies for retail are differentiated by customer value tier. High-value customers respond to recognition and relationship, not discounts. Mid-value customers respond to habit formation through post-purchase sequences and loyalty mechanics. At-risk first-purchase customers respond to a timely, category-relevant post-purchase sequence timed to their repurchase window.
What is a good customer retention rate for retail?
Retail retention rates vary significantly by category and format. Ecommerce retailers typically see annual retention rates in the 25 to 38% range (meaning most customers do not return within 12 months), while omnichannel retailers with strong loyalty programmes can achieve significantly higher rates. The more useful benchmark is your own cohort trend: whether retention rates for customers acquired this year are higher or lower than for customers acquired in previous years.
How do you calculate customer retention rate?
Customer retention rate is calculated by dividing the number of customers who made at least one purchase in the current period by the number of customers who were active in the previous period (excluding new customers acquired in the current period), then multiplying by 100. For retail, it is most useful calculated at the cohort level (e.g. of customers who first purchased in Q1 2025, what percentage made a purchase in Q1 2026?) rather than as a single aggregate figure.