
June 9, 2026
|
8
minute read
How to calculate the ROI of a CDP for a mid-sized retailer


Most mid-sized retailers approach CDP investment with a reasonable question and no good way to answer it: what return should I actually expect before I sign? This guide walks through a worked calculation using a realistic retailer profile across three high-value use cases, so you can build a credible estimate before you commit.
The short answer
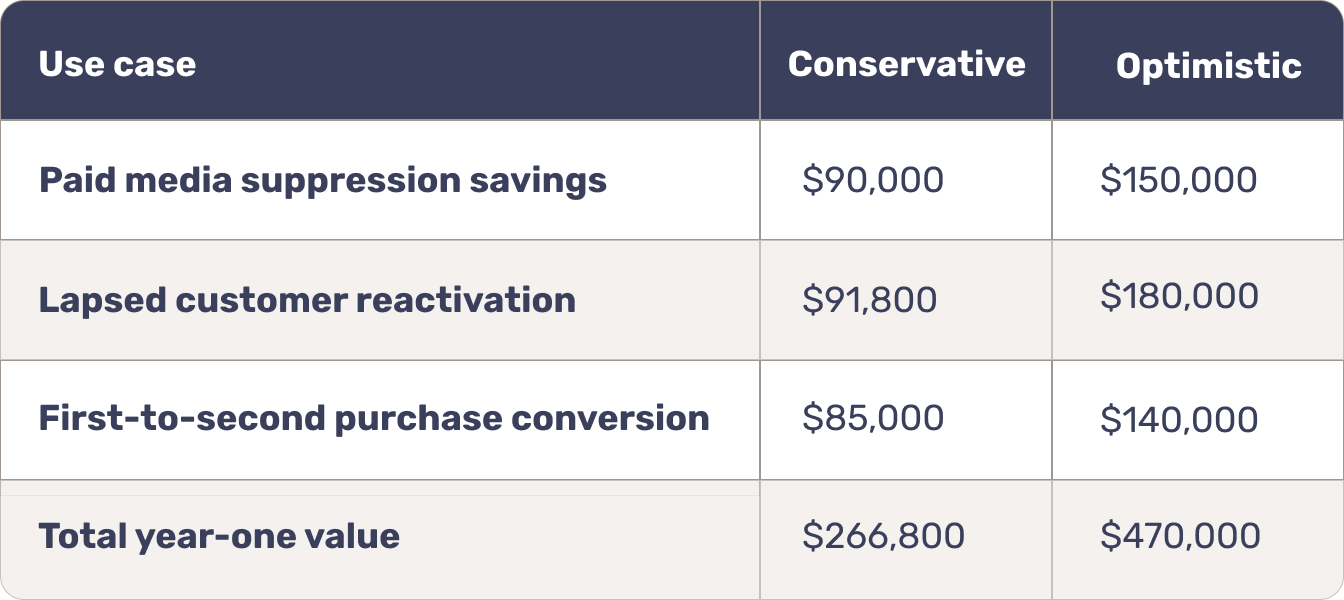
A mid-sized retailer with around $20 million in annual revenue and 150,000 customers can typically expect CDP-driven value across three areas in year one: paid media waste reduction, lapsed customer reactivation revenue, and first-to-second purchase conversion uplift. A conservative combined estimate across those three use cases for a retailer at this scale lands between $266,800 and $470,000 in year one, before accounting for the compounding effect of improved data quality on every subsequent campaign.
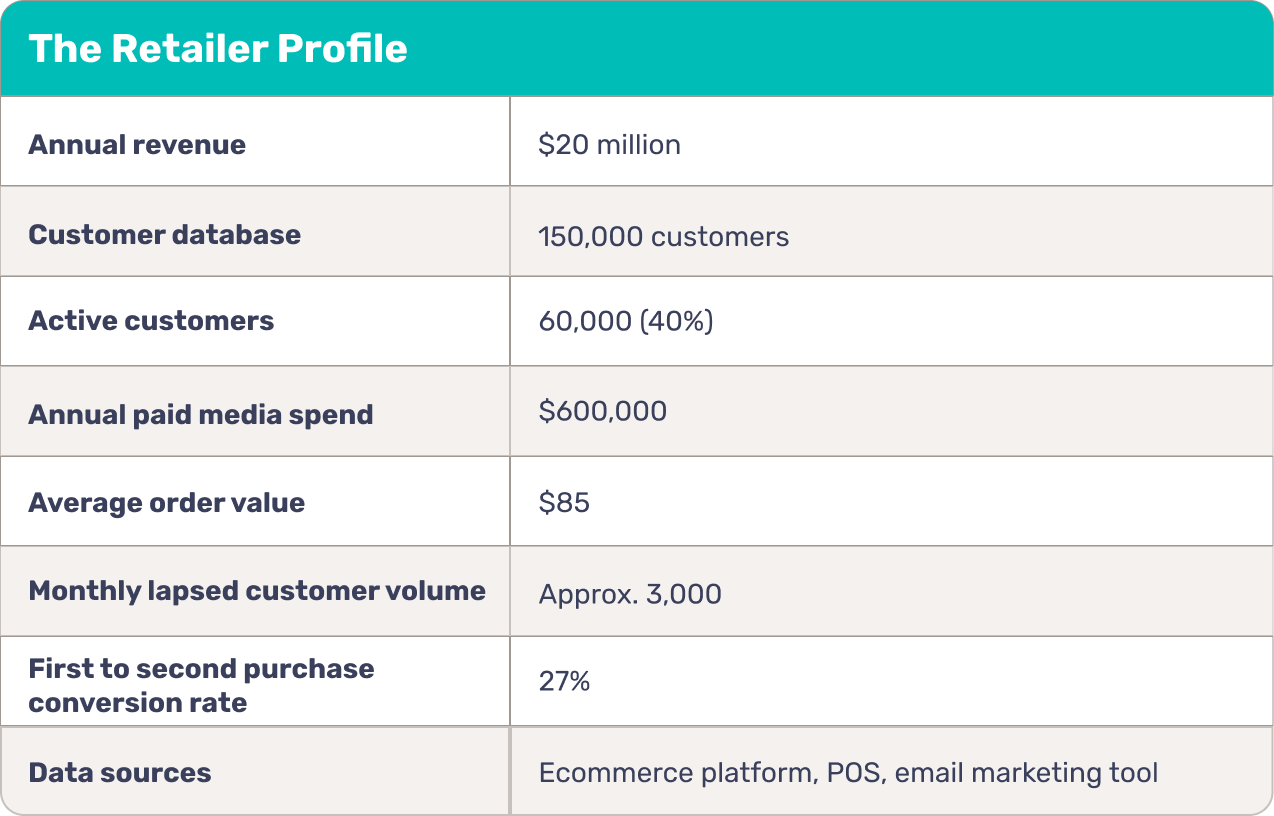
The retailer profile used in this worked example
To make these calculations concrete rather than generic, they use a single consistent retailer profile throughout:
- Annual revenue: $20 million
- Customer database: 150,000 customers
- Active customers (purchased in last 12 months): 60,000 (40%)
- Annual paid media spend: $600,000
- Average order value: $85
- Monthly lapsed customer volume: approximately 3,000 customers moving from active to lapsed each month
- First-to-second purchase conversion rate (current): 27%
- Data sources: ecommerce platform, POS, and an email marketing tool
This profile is representative of a mid-market omnichannel retailer across apparel, homewares, or specialty retail. Adjust the inputs for your own numbers, as the framework holds at different scales.
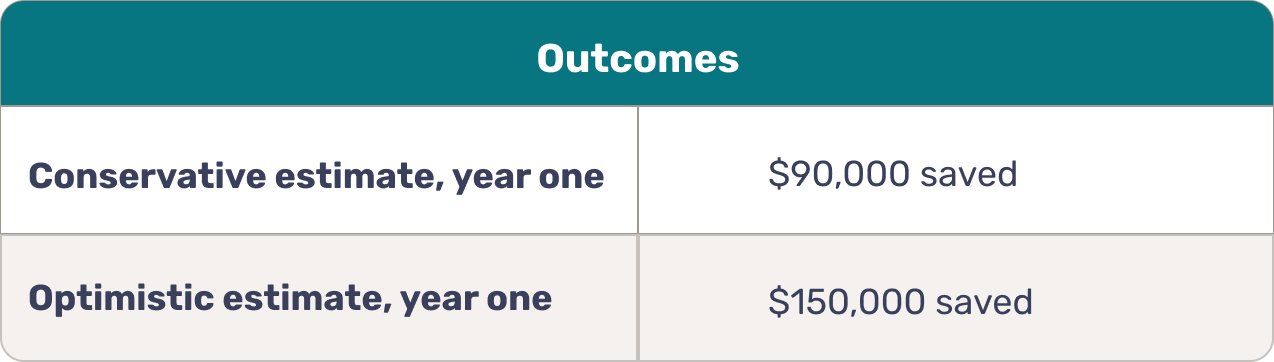
Use case 1: Paid media suppression savings
A CDP generates immediate paid media savings by removing existing customers from acquisition audiences, stopping you from paying to re-acquire people you already have.
The problem without a CDP: most retailers running Meta or Google acquisition campaigns cannot easily exclude their full customer database in real time. Existing customers, including recent purchasers, end up inside acquisition audiences. You pay acquisition CPMs to reach people who already know your brand, often converting them at a fraction of the efficiency of a genuine prospect.
The calculation:
Using our retailer profile:
- Annual paid media spend: $600,000
- Estimated wasted spend on existing customers and low-quality audiences: 15–25% (a conservative industry estimate based on typical audience overlap rates before CDP suppression)
- Waste recovered through suppression and higher-quality lookalike audiences: $90,000–$150,000 annually
Improved lookalike audience quality is harder to express as a direct saving but shows up as improved ROAS over time. When your lookalike seed audience is built from your top-value customers rather than your full list, the prospects you reach share characteristics with your best buyers rather than your average one.
Conservative estimate, year one: $90,000 saved
Optimistic estimate, year one: $150,000 saved
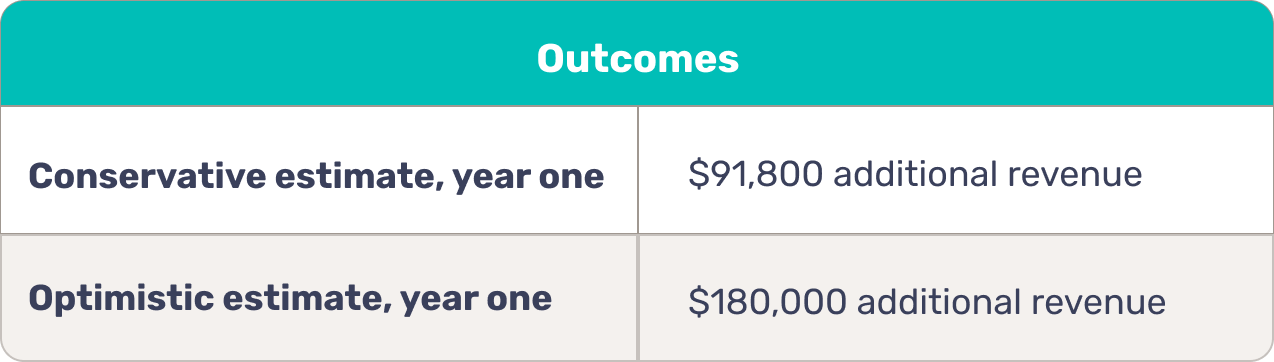
Use case 2: Lapsed customer reactivation revenue
A CDP enables targeted reactivation of lapsed customers by identifying who has gone quiet, when they lapsed, and what they are most likely to respond to, producing incremental revenue that broad win-back campaigns cannot match.
The problem without a CDP: most retailers treat lapsed customers as a single segment and blast them with a generic discount. Without a unified view of each customer's purchase history, category affinity, and lapse point, you cannot personalise the reactivation message or time it to the most recoverable moment.
The calculation:
Using our retailer profile:
- Customers moving into lapsed status each month: approximately 3,000
- Annual volume of newly lapsed customers: approximately 36,000
- Reactivation rate with generic win-back campaigns (typical): 3–5%
- Reactivation rate with CDP-powered behavioural segmentation (conservative uplift to): 6–8%
- Incremental customers reactivated annually (conservative: 2% uplift on 36,000 lapsed): 720 additional customers
- Average order value: $85
- Assumed average of 1.5 orders from a reactivated customer in year one: $127.50 revenue per reactivated customer
- Incremental revenue: 720 customers × $127.50 = $91,800
This is conservative. It assumes only a 2 percentage point improvement in reactivation rate and only 1.5 orders from each recovered customer. Retailers who run sequenced, behaviour-triggered reactivation programmes, rather than a single win-back email, typically see higher recovery rates and higher order frequency from reactivated customers.
Research by Frederick Reichheld of Bain & Company, cited in Harvard Business Review, shows that a 5% improvement in customer retention rates can increase profits by 25–95%. Reactivation at even a modest scale compounds meaningfully over time because each recovered customer begins generating repeat purchase revenue rather than requiring re-acquisition spend.
Conservative estimate, year one: $91,800 additional revenue
Optimistic estimate, year one: $180,000 additional revenue (3 percentage point uplift in reactivation rate, 2 orders per recovered customer)
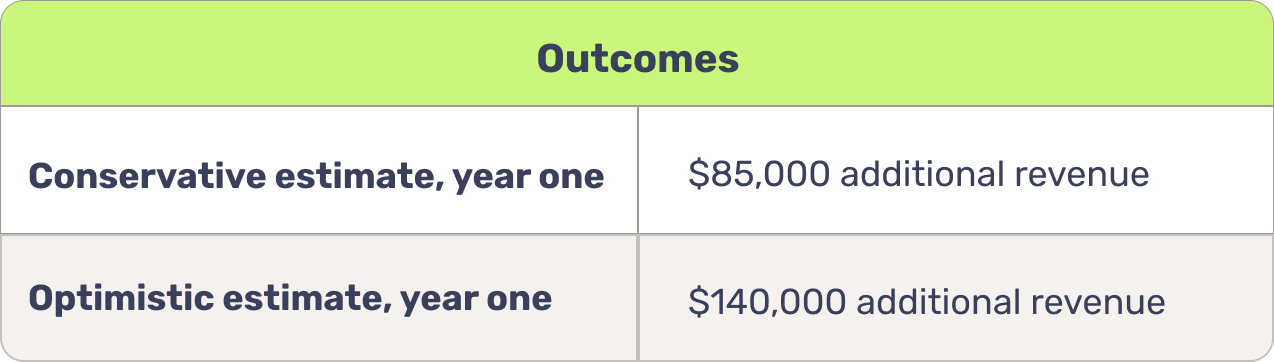
Use case 3: First-to-second purchase conversion uplift
A CDP improves first-to-second purchase conversion by enabling post-purchase sequences timed to each customer's actual repurchase window, rather than arbitrary follow-up cadences applied uniformly across the database.
The problem without a CDP: most retailers' post-purchase sequences are set to a fixed cadence; a follow-up email at seven days, another at fourteen, regardless of how that customer actually behaves. A customer who typically repurchases every 45 days gets the same follow-up as one who repurchases every 10 days. Neither sequence is timed to the real repurchase window.
The calculation:
Using our retailer profile:
- New customers acquired in a year: approximately 25,000
- Current first-to-second purchase conversion rate: 27%
- CDP-enabled improvement (conservative uplift to 31%): a 4 percentage point improvement, achievable through repurchase-window-timed communications and category-relevant follow-ups
- Incremental customers reaching a second purchase: 25,000 × 4% = 1,000 additional customers
- Average order value: $85
- Incremental revenue: 1,000 × $85 = $85,000
The downstream value is larger than this single-order figure suggests. A customer who reaches a second purchase is 49% likely to make a third, at which point their retention probability rises to 62%, according to Smile.io. Converting more first-time buyers into repeat purchasers has a compounding effect on lifetime value that single-year calculations understate.
Conservative estimate, year one: $85,000 additional revenue
Optimistic estimate, year one: $140,000 additional revenue (6 percentage point uplift, assumed second-purchase AOV of ~$93)
What a conservative vs optimistic year-one estimate looks like
These figures use deliberately modest assumptions: a 2% reactivation uplift, 15% paid media waste recovery, and a 4 percentage point improvement in first-to-second purchase conversion. Retailers entering implementation with clear use cases and strong internal adoption typically see results at the higher end of this range within the first 12 months.
What these figures do not capture: the value of improved data quality on every subsequent campaign, the reduction in time spent on manual reporting and audience building, or the compounding retention value of customers who reach a third and fourth purchase.
For the framework for measuring these outcomes once you are live, see How to measure CDP ROI in the first 6 months.
Real-world anchor: what CDP-powered campaigns actually return
The calculations above use a hypothetical retailer profile. Real-world results vary by brand size, category, and execution maturity, but the underlying mechanics hold.
CALECIM® is a premium skincare brand with a 14,000-customer database, a smaller profile than the $20M retailer modelled above, but facing an identical problem: 75% of their customers were inactive or lapsed, and first-to-second purchase conversion was low. Using Lexer's segmentation tools to build personalised, behaviour-triggered email sequences, they increased repeat sales by 31% within six months.
The brand profile is different, but the use case is the same as use cases two and three in this guide: identify who is lapsing, understand their purchase behaviour, and communicate in a way that is timed and relevant rather than generic. The mechanism that drove CALECIM®'s result is directly transferable to a mid-market omnichannel retailer, at larger scale, with more data sources feeding the segmentation.